


Today’s Nuggets
Bitcoin will be Adopted like Gunpowder
Strive Asset Management Moving to BTC Standard
Solana’s Leads All Other Networks
Monster MSTR News
Tesla Cortex Live
Fed Cuts 50bps, 10 Year Jumps 70bps
Stanley Quitely Makes a Killing
CBDCs “Likely Need to Replace Stablecoins”
It has been a crazy historical week, although you would not notice it in some of the price action. I will try to answer: "Will we ever see $70,000 again?"
There is an interesting twist to that question. Despite all the money that went into the ETFs, Bitcoin price only went up $2,000, which is bizarre.
Crypto Market Summary:
The crypto market cap is still around $2.35 trillion;
Bitcoin dominance is high at 59.2%, as it has outperformed many altcoins; and
The Bitcoin price was at $69,500.
November is normally one of the most bullish months for Bitcoin and it is setting the stage for a potential continuation of October, which was up 11.5% (building on the 8% gains in September).
My theory is nobody is currently smashing the buy button because everybody is worried about...three more days. The U.S. election has been a big gray cloud over our heads.
In a couple more days, we should be free and clear.
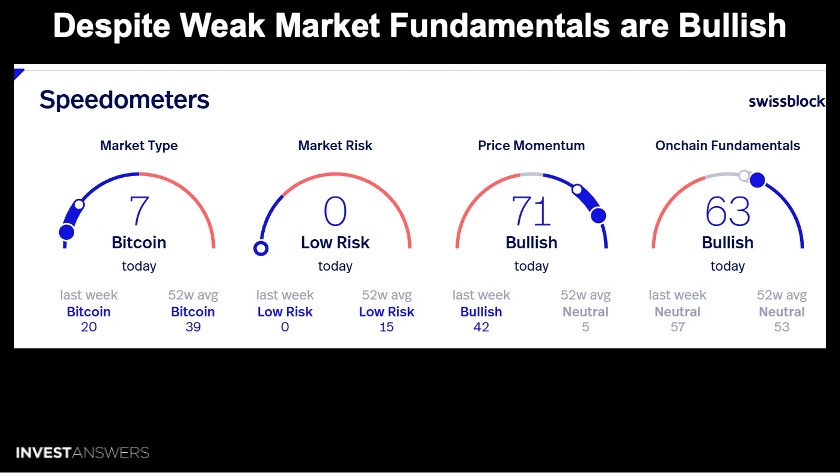
Reading the swissblock speedometer:
Bitcoin today is bullish;
Low risk from a risk perspective;
Price momentum is bullish; and
On-chain fundamentals are bullish.
Everything is good, so we are setting the stage for a potential Moon-vember. Like in September, sometimes you have to wait five to ten days before that to kick in. We might have to wait exactly six days, with the greatest fears starting to fade.
Brace yourself, as it will be volatile.

Here is a summary of the number of Bitcoin bought by the ETFs last week.
30,754 BTC was bought versus only 3,150 BTC mined. I hear daily groans that ‘Bitcoin is only up $2,000’. Well, I produced a video lesson this week to try to explain the BTC price action, so check it out:
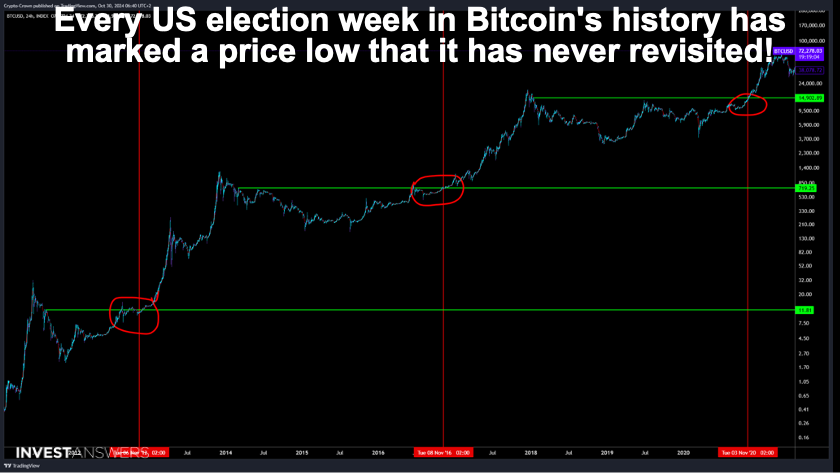
This one is an interesting chart supplied by Crown Crypto Cave. The red lines mark the U.S. election day of November 5th over Bitcoin's life. What you see here is the historical pattern of Bitcoin price action.
Bitcoin price action has always been intriguing during the week of the past three U.S. presidential elections: 2012, 2016, and 2020. The week leading up to the election marked a significant low point for Bitcoin's valuation.
What is particularly striking about this pattern is its lasting impact. Following each of these election-week lows, the Bitcoin price has never again dipped below that level. If history repeats, these pre-election weeks have consistently acted as a springboard for Bitcoin's long-time price appreciation and a price floor... this is why the story today is about how we may never see $70K again.
According to the chart, the 2012 election established the price floor, and that held firm ever since that date. You see the same thing in 2016 pre-election week with a new baseline for Bitcoin's value. In 2020, the trend continued.
We will see if history repeats…
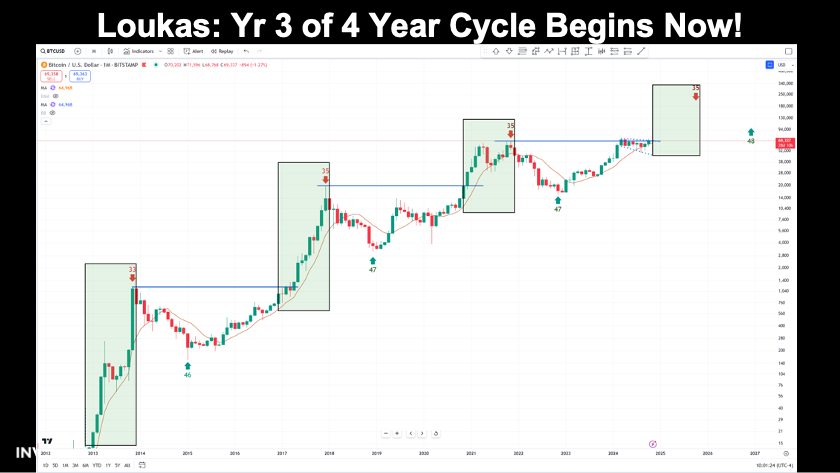
Bob Loukas says that Bitcoin does not
Keep reading with a 7-day free trial
Subscribe to InvestAnswers Newsletter to keep reading this post and get 7 days of free access to the full post archives.