


Today’s Nuggets
Record Growth in Long-term Holder Supply
Cycles & Elections
Crypto Adoption to the Moon
Dubai Approves Crypto Salaries
Ethena is One of the Biggest Losers
The Best Selling $100K+ & EV Truck
Global Debt Hits a New All-Time High
This is where we attempt to recap where we are from last weekend to determine what actually happened.
The crypto mark cap is about just under 2.1 trillion. It has been flat for most of August and the month has not been kind to us.
The Bitcoin dominance is around 55%. The Fear and Greed Index fell yesterday from 27 down to 25, which is not good. Ethereum is at about $2,600, with Solana hovering around $150.

Bitcoin has not performed badly, as it is only down 0.5%.
Ethereum beat Bitcoin up half of 1%.
Solana was down 9%.
Binance is the only dark green spot for the whole week.
A lot of stuff is kind of mixed all over the place, making no real pattern that we can hold on to here.
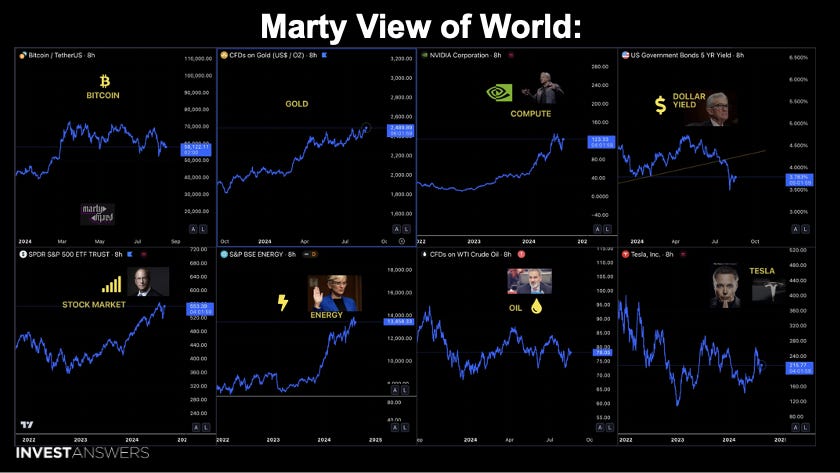
Here is a quick MartyParty tour of the world to find out exactly what is going on:
Gold is breaking out.
Bitcoin is hanging in there, but it is lagging behind gold.
Compute is up.
The dollar yield is down, which is good.
The stock market is at all-time highs.
Energy is at all-time highs.
Oil is in the middle of the range.
Tesla is kind of middle of the range too.
Bitcoin has had a sucky couple of weeks because of what I call the 5Gs:
Mt. Gox;
Grayscale;
Genesis; and
Governments (Germany & United States).

Between the 18th of July and the 14th of August, an astonishing 285,000 Bitcoin was added to the supply by long-term Bitcoin holders, marking a notable shift in market dynamics after months of decline.
When you look into this data, it is the largest single-month increase that has ever happened. This trend is not just a fleeting phenomenon. Of course, it is intricately tied to the ETF holdings.
The institutional confidence might be at an all-time high but the price has not really followed. It is kind of weird but we will dig deeper into that.

I added a big black arrow on this chart to show you the black line of the current cycle, which is 2022 to 2025. The yellow line is from 2018 to 2021 and the blue line is from 2014 to 2017.
Many people believe the black line is closest to matching the blue line, the 2017 cycle. I hope so because that means it could be a bonkers market.
The other thing to note about this chart is the red arrow, where the election is on the 5th of November - only 80 days away. Historically, Bitcoin went up during this period in the cycle.
Will November and December be bonkers? That is what remains to be seen…
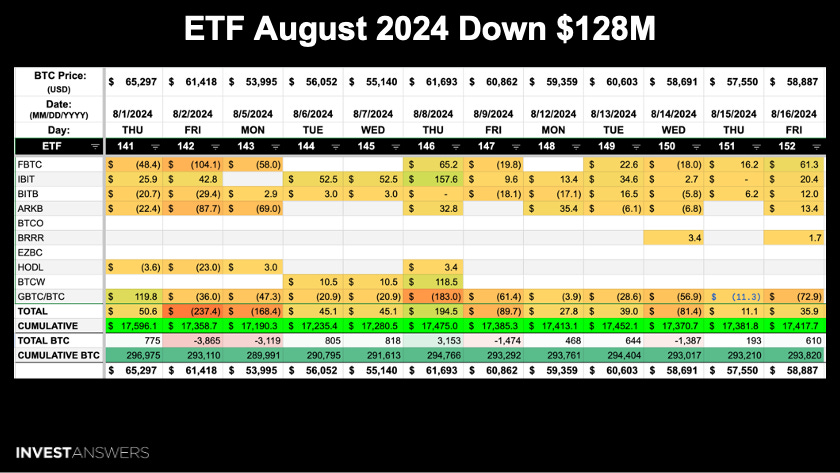
The BTC ETFs have bled out $128 million in August. We saw a big selling ahead of the carry trade crisis but it has been rebounding pretty fast.
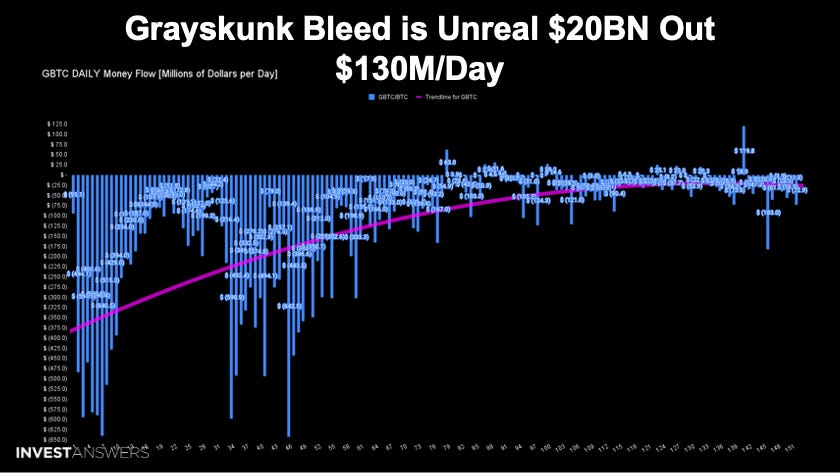
The Grayscale bleed is unreal, with 152 days of non-stop bleeding.
It has averaged outflows of $130 million daily, which is not slowing, as $73 million went out yesterday after bleeding $20 billion.
Despite their mini Grayscale trust, it is not slowing down by any stretch…
While the Bitcoin is up due to the ETFs, they continue to combat the bleed from Grayscale.
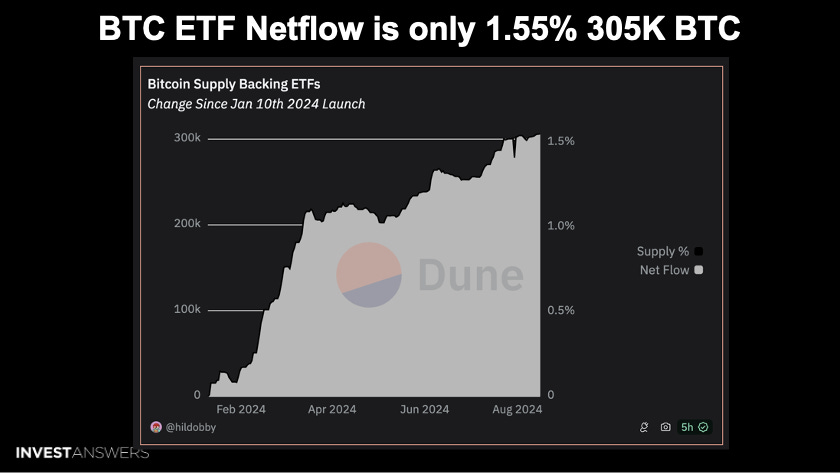
4.65% of all Bitcoin is now in ETFs, but the net flow is only 1.55%. This is only 305,000 Bitcoin, which is only a little bit higher than Michael Saylor's bag. The ETFs have taken the $20 billion from Grayscale and added another 305,000 Bitcoin. The amount of flow does not correspond exactly to the amount of Bitcoin because of price variations.
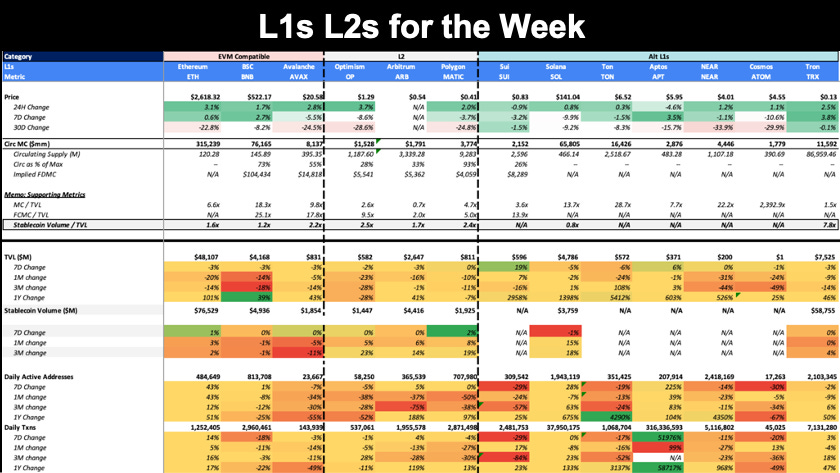
Here are the L1 and L2 winners for the week.
Tron wins the seven-day price change.
SUI wins the total value locked.
MATIC wins the stablecoin volume.
APT wins the daily active users.
APT wins the daily transactions.

Big inflows into Arbitrum to the tune of about $600 million, while Solana experienced about $200 million of inflows over the last month. In number three, BASE is really turning heads and doing many exciting things.
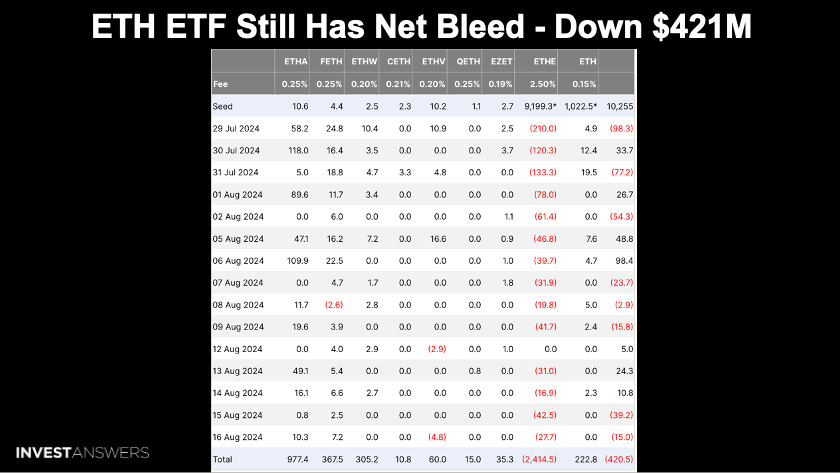
Over the last month, we saw something very interesting happen…
Ethereum experienced a huge bleed to the tune of nearly $1.4 billion. You can see that they are down $421 million since the ETH ETF launched.
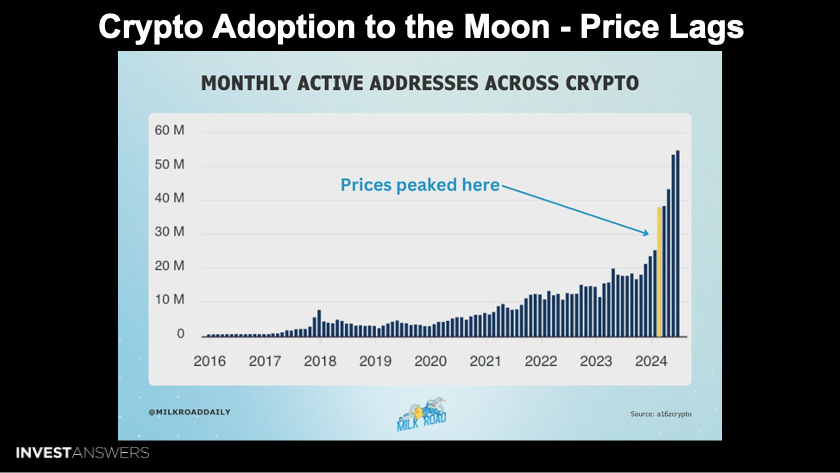
Yellow marks the level of crypto adoption where crypto prices peaked.
There were about 37 million users and active addresses. The monthly active address for crypto keeps on going up but we have not had highs since five months ago.
What is going on?
I always say Bitcoin
Keep reading with a 7-day free trial
Subscribe to InvestAnswers Newsletter to keep reading this post and get 7 days of free access to the full post archives.