


Today’s Nuggets
OKX Triggers Spike in Fees
Is BlackRock the Bitcoin Black Hole?
Up to 7 Years of Prison for Craig Wright
Hunters Clean Out Longs Down to $69K
Bitcoin’s Most Bullish Trend Setup
Historical Bitcoin Post-Halving Performance
Bitcoin Energy Gravity ($/kWh) is Down
There was some monster Bitcoin long-hunting today. Looking at the ETF flows over the last 18 days will blow your mind, yet the price is not where it should be. This is called market manipulation, but I want to encourage you to zoom out and forget about the short-term noise in this lesson.
The crypto market cap is $2.63 trillion, with a volume of $81 billion. Bitcoin was $70,900 but is now $69,280. It has fallen $1,500 in minutes, hitting levels we have not seen since Tuesday. The Fear and greed is 77, which is extremely high.
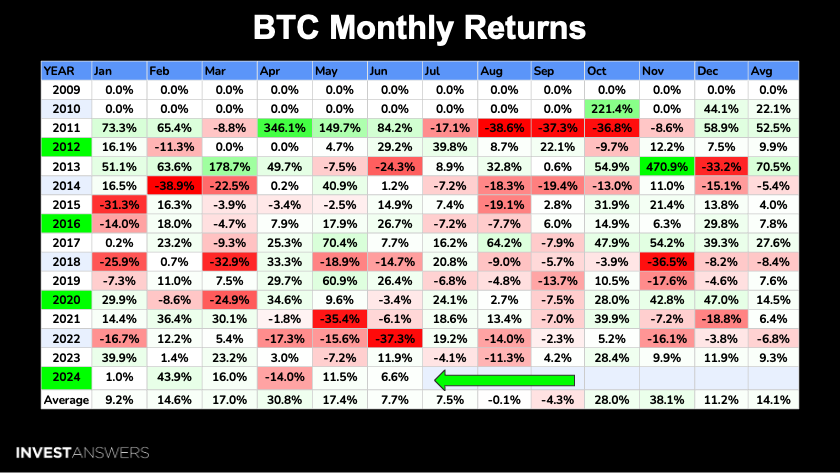
As of an hour ago, Bitcoin was up 6.6% for the month.
Ignore the noise and zoom out!
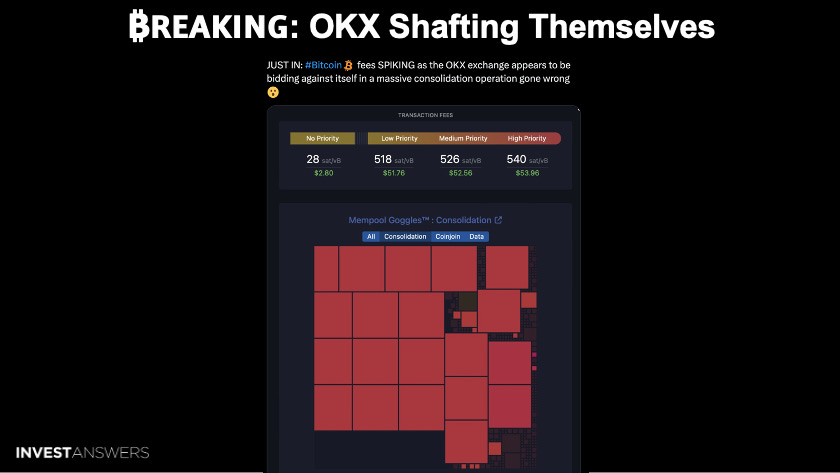
OKX has triggered a spike in Bitcoin fees because it appears to be bidding against itself.
What does that mean?
OKX is causing unusually high Bitcoin transaction fees because it made some mistakes in its consolidation process. It is performing what may be a massive consolidation operation.
They are trying to combine many smaller transactions into large ones, a process that can save fees during normal times but may have backfired, leading to higher fees and congestion on the Bitcoin network.
To save money, they are spending a lot more money and making it difficult to play with Bitcoin today.
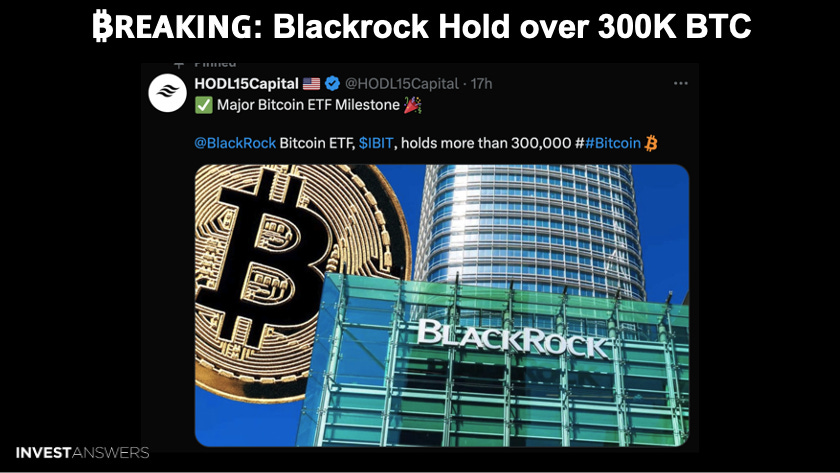
In other news, BlackRock - the new big black hole - now holds more than 300,000 Bitcoin. It was only recently that they eclipsed MicroStrategy at about 240,000.
Now they are way, way ahead!

Here is a log chart that is easier to read.
The green is the total of the ten ETFs listed here. We now have 285,000 Bitcoin in Grayscale, which started with 621,000 on January 11th. IBIT is now at 302,548, and FBTC is coming in at 173,759. ARKB is coming in third at 48,939.
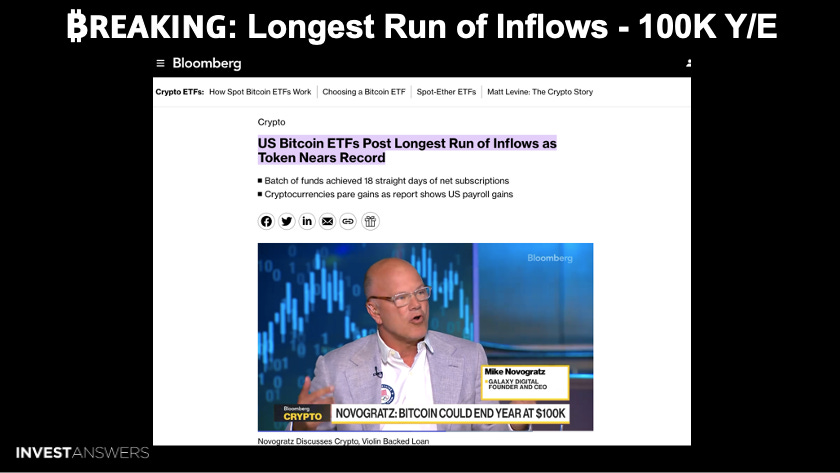
This headline was true as of a few hours ago…
However, a batch of funds achieved 18 straight days of net subscriptions, which has never happened before.
Mike Novogratz is on TV and believes Bitcoin could end the year at $100,000.

I will pull up some charts to see if this is even feasible…
In addition, we will look at some mathematical odds of where the punters are playing right now on this gambit.

One of my wishes for 2024 was for this to be the year of truth for everybody.
The judge may impose an extraordinary response of up to seven years in prison for Craig Wright's lies alongside severe penalties and custodial sentences.
He pretended he was Satoshi Nakamoto - which is pathetic - and needs to go to jail.

This is the Bitcoin liquidation map on Binance. You can see that right now, they are hunting down that little bit of yellow streak. The hunters cleaned them out and they went down to $69K. These are dynamic, moving targets - things can change very radically.
We know what happens at the weekends. I have calculated the average gainers every weekend since January 11th.

This is from an internet betting site similar to Polymarket, where people can place bets. These are the odds of when Bitcoin could hit 100,000 and you can see some people are betting before August-December. Standard Chartered is betting big in November.

It is easier to view in this chart.
The later we go, the better it looks - the higher the odds.
Many believe there is a good chance of earning $100,000 Bitcoin by the end of the year.

Gold is at the top of the charts with $15.6 trillion. Bitcoin is now number nine, breaking into the top 10 not too long ago. It surpassed Meta Platforms (Facebook) with about $1.39 trillion in market cap.
If Bitcoin goes to $100,000, where will it be on this chart, assuming the other assets stay where they are?
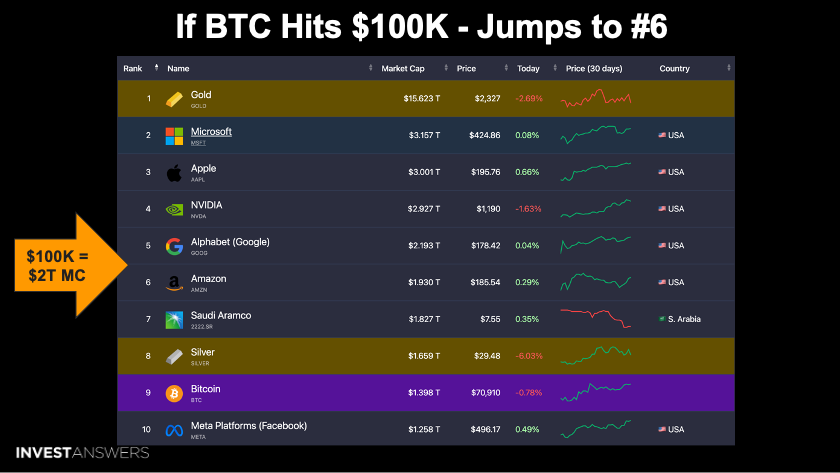
Here is the answer: Bitcoin would reach a market cap of ~$2T, surpassing Amazon's value today at number six on the list.
The higher you go up this list, the more attention the asset class gets, as a whole.

This is a chart of the Bitcoin power law to $1M, which displays the relationship between BTC's price and time using a simple logarithmic regression analysis.
The curve implies the following average prices for Bitcoin over the next cycles:
$100,000 again in 2025. Every single indicator looks like that is a lock. We do not know when.
$500,000 in 2030
$1,000,000 in 2033
Again, it is like the old story that it is
Keep reading with a 7-day free trial
Subscribe to InvestAnswers Newsletter to keep reading this post and get 7 days of free access to the full post archives.