


Today’s Nuggets
MSTR Buys the Dip
U.S. ETFs Eat Up 1.78 of Issuance
The Fifty Bip Flip
Russian Envoy Warns NATO of Direct War at UN
Stablecoins are All Dollars
All DEX Traders are on Solana
CyberCab in the Wild?
FDA Approval for Airpods as Hearing Aids
Younger Americans Report More Cognitive Disability
This is our new weekly episode series, Friday Fire, in which we cover the weekly good and bad fires.
We will cover approximately 40 different topics. This one is called War Worries because of the gold action we are seeing right now. Things like gold and Bitcoin can sense things in the market.

Fear is still here for Rektember but this has not turned out to be a typical Rektember.
We experienced the initial dip but as I said, too many tailwinds are happening, so everything has shifted. It looks like most of the damage was done in August, as things are rebounding pretty fast.

The ETFs have been horrible in September.
TradFi nailed selling at the bottom. Over $500 million of ETFs have been sold so far this month. We did have two positive days but September was still mostly negative.
Do not sell at this level; it is craziness.
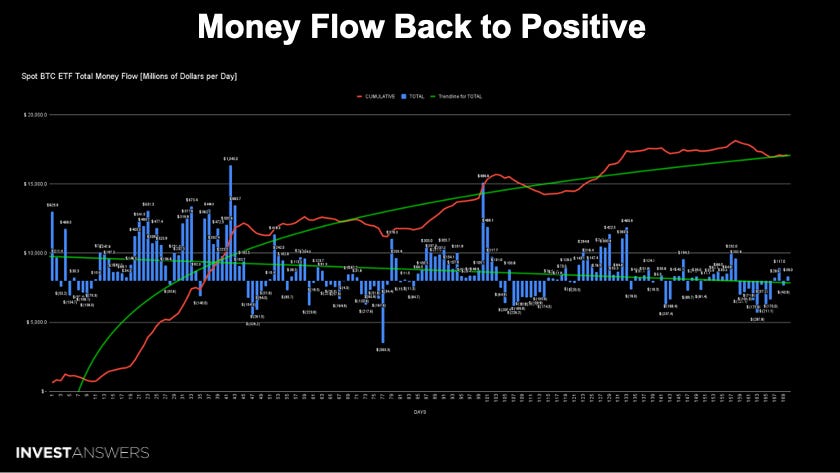
We have had three positive days so far but there have also been many negative days. Overall, BTC ETFs are still down half a billion dollars.
For 13 days now, BlackRock has bought nothing.
Their big buy is just mounting up at that market maker, probably a quarter of a billion-dollar buy. It is probably coming tonight or next week.
This is nearly one and a half times the daily issuance, not as not bad as we plug along.
Remember, other players are buying alongside the ETFs.
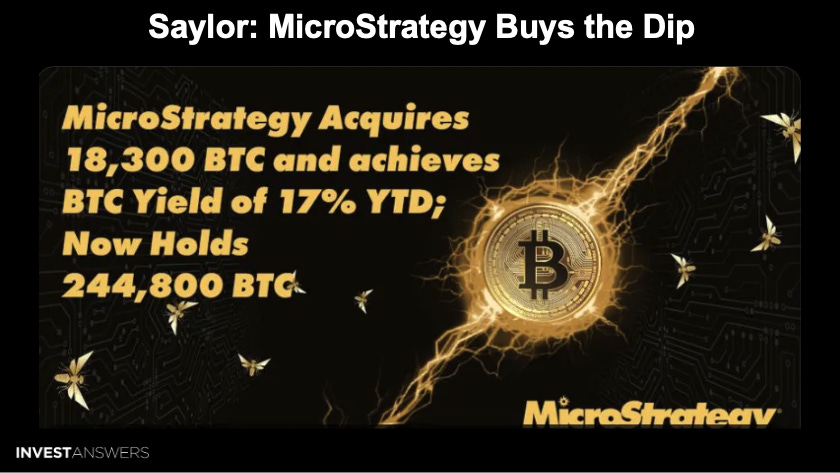
Mr. Saylor bought the dip and got a really good price.
Michael Saylor continues to show the world what it means to be orange-pilled. MicroStrategy executed another Bitcoin buy, increasing its total holdings to 244,800 Bitcoin, which is over 1.1% of the total supply. This is about half of their allotted amount, approximately $1.1 billion. MSTR has another $900 million to go.
Each buy results in MicroStrategy claiming its slice of the digital scarcity pie and fortifying its balance sheet against perpetually devaluing fiat currencies. The company borrows money at zero interest rate, issues shares, and buys more Bitcoin. MSTR is sitting on nearly $4.9 billion of gains.
The infinite money glitch is working really well.
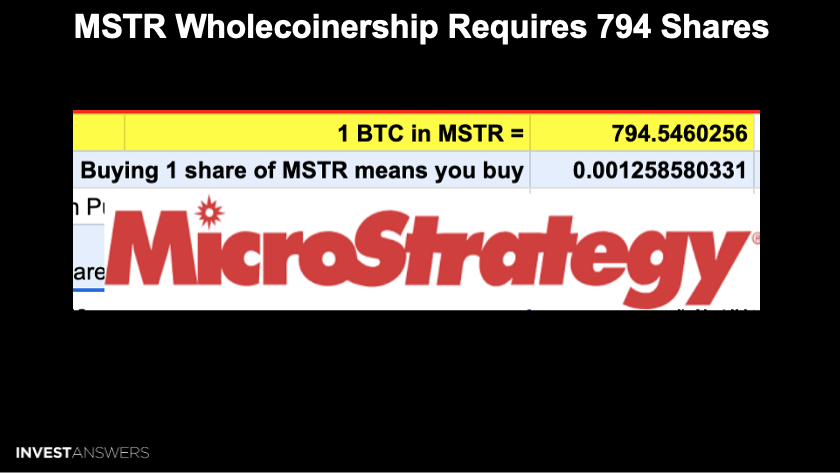
This is from our MSTR Arb model, and I shared an update regarding this on Patreon this morning.
To get one whole coin, you need 794 MicroStrategy shares, which would have been 79 shares before they did a 10 for 1 split.
There is nothing wrong with this approach to becoming a whole coiner, although I always vouch for pure form when possible.

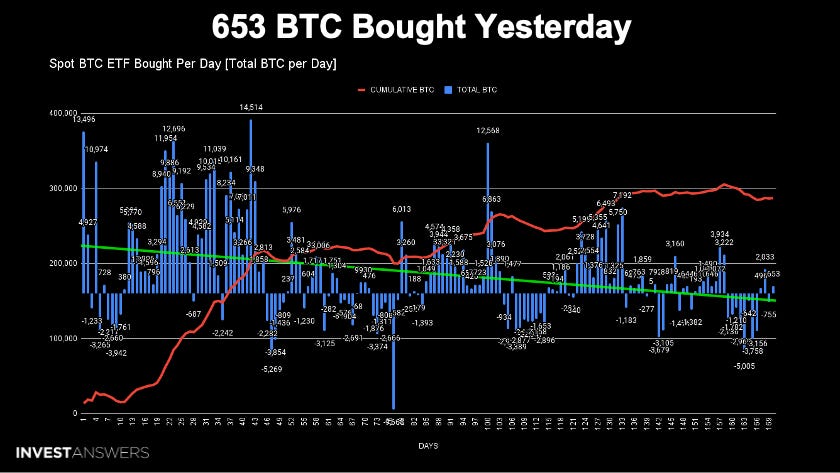
This chart shows how the ETFs—just nine American Bitcoin ETFs in a nation with 4% of the planet's population—have eaten up 1.78 times the issuance since inception.
161,945 Bitcoin were mined since inception and the U.S. ETFs bought 287,000. Again, wait until this stuff really catches on.
Price is the best advertising for this puppy and I think the buying action will return when the price comes back.

This cool little chart from BlockTrends shows that Bitcoin is the best asset to protect against Brazil's 13% to 15% yearly currency depreciation.
Notice I always talk about 14% debasement. BlockTrends warns that without assets earning interest or salary growth exceeding this rate, you are not treading water. This is what I refer to as the hurdle rate.
Bitcoin is a hedge that can offset this depreciation so that you are not losing money every year.
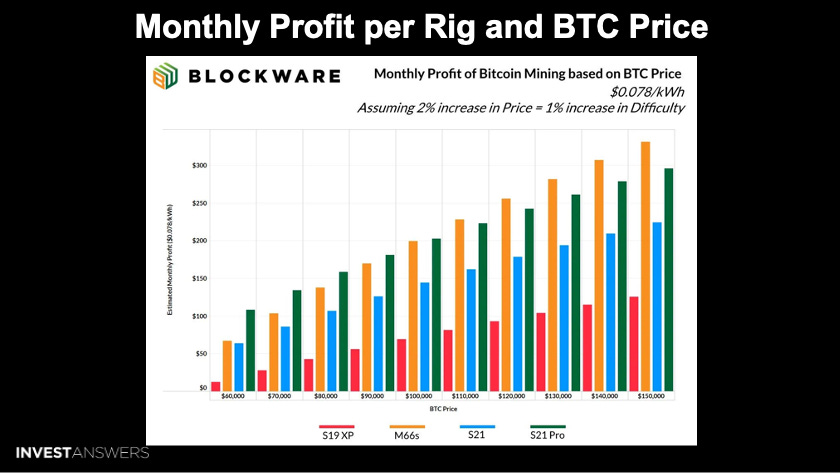
This chart is from Blockware and it looks at some very interesting projections up to $150,000 Bitcoin.
If you are a miner, you want to get more of the green if you can. Assuming electricity costs 7.8 cents per kilowatt hour, this shows you how much money you can make a month from a rig per different Bitcoin prices.
If you have the S21 Pro, you can make $300 a month per rig if Bitcoin goes to 150 grand.

This fifty-bip flip happened over the last 24 hours.
Yesterday, the odds of a 50 basis point cut were about 16%. All of a sudden, they shot up to 45%. Remember, the bond market can always sniff out the problem.
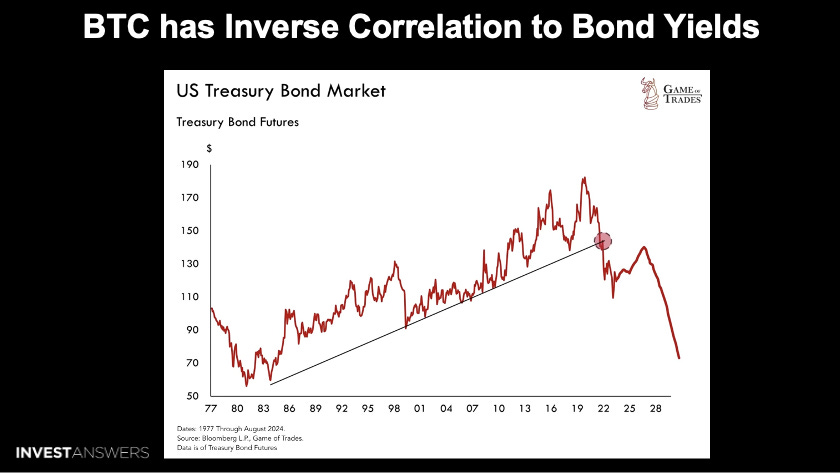
This beautiful chart from Game of Trades illustrates the historical trend of U.S. Treasury bond futures from 1977 to today. The red dot shows where it ends today but it shows a long upward trend until 2022, when we came out of the zero interest rate environment. Since then, it has been in a significant decline.
This chart highlights a break below the longstanding support line, indicating a potential shift in market dynamics. Why do we care? Because we care about Bitcoin. There is always an inverse correlation with bond yields. Bitcoin's price has shown an inverse correlation with the US real bond yields. When bond yields rise, Bitcoin prices tend to fall and vice versa. Investors may prefer safer returns from bonds over risky assets like Bitcoin as bond yields increase.
The break in the trend line could signal
Keep reading with a 7-day free trial
Subscribe to InvestAnswers Newsletter to keep reading this post and get 7 days of free access to the full post archives.