


NUGGETS OF ALPHA
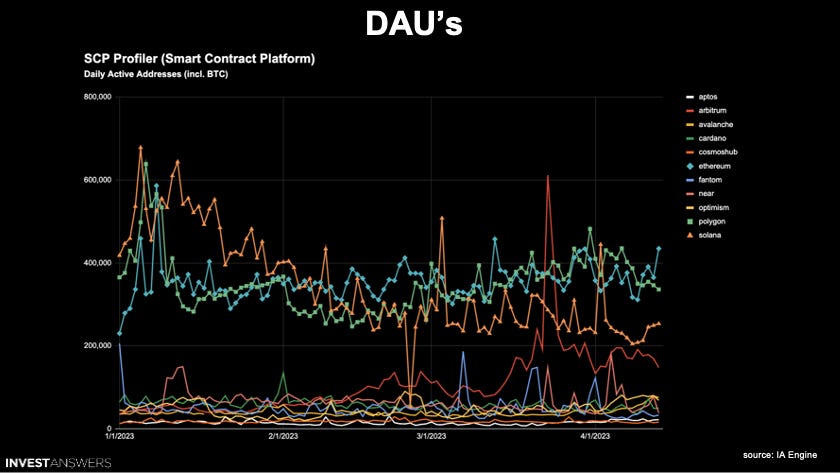
Solana’s daily transactions are trending up and about to go ballistic
Most chains remain over 90% down on average from their all-time high price
Solana’s daily market cap growth is ~150% In 2023
MATIC has the best Market Cap / Daily Active Users ratio
BNB chain experienced the highest level of adoption in 2023
Ethereum has the most development activity by a clear margin
ARB, OP, and TRON have the best Market Cap / Total Value Locked ratio
Solana received the highest SCP score, followed by MATIC and Ethereum

Today we will analyze smart contract platforms by reviewing the top L1s and L2s. Our analysis will come from 12 key data points and ratios that will help you determine the good and the bad.
We are probably 20% into this crypto bull run. This is the kind of crypto quant that you need to capitalize on this emerging bull market.

In my mind, a blockchain is the same as a mall or shopping center. A chain’s success is a function of different stores: dApps, infrastructure, security, ability to attract customers that transact, etc.
Ghost Malls have no dApps and no customers.
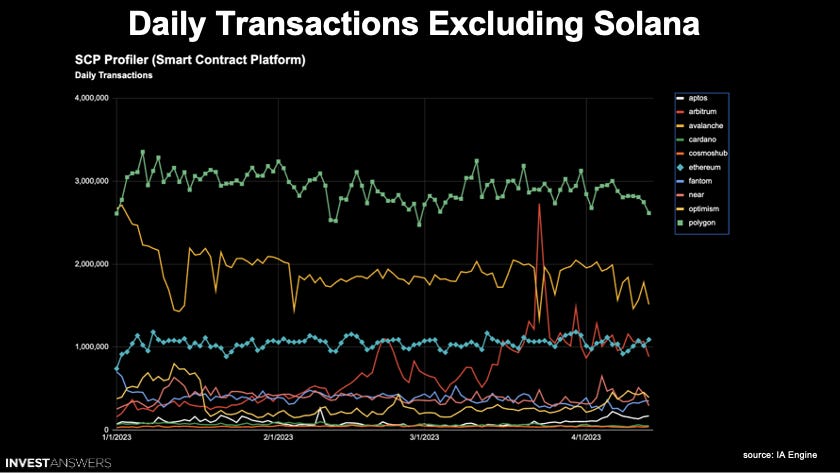
The clear leaders in daily transactions are:
Solana #1 (not listed on our first chart)
Ethereum #2
Polygon (ETH L2) #3
Most chains' daily transactions have decreased over the last four months.
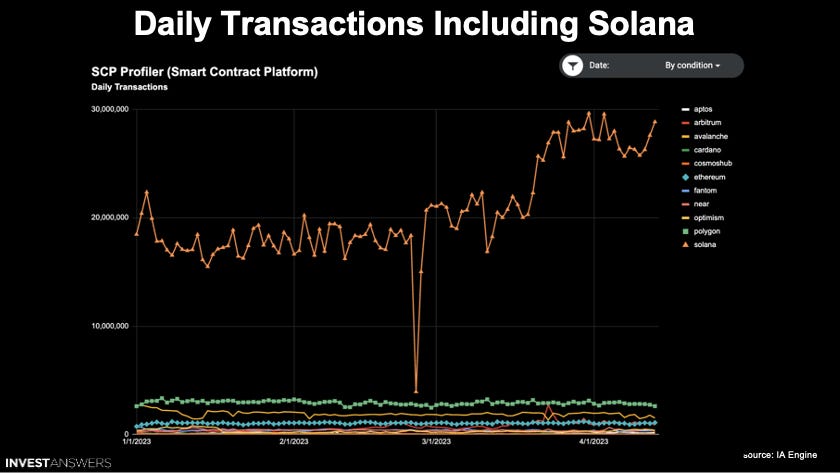
Solana, on the contrary, is up, and the trend is about to go ballistic.
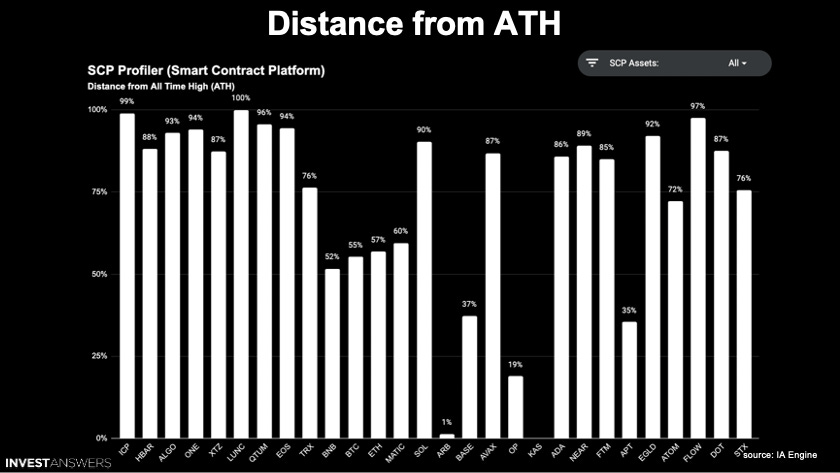
This distance from the all-time high is still over 90% down on average. However, a few exceptions are the recently launched ones (e.g., OP, AB, APT, BAE).
The legacy chains such as BNB, BTC, ETH, and MATIC are holding up well.
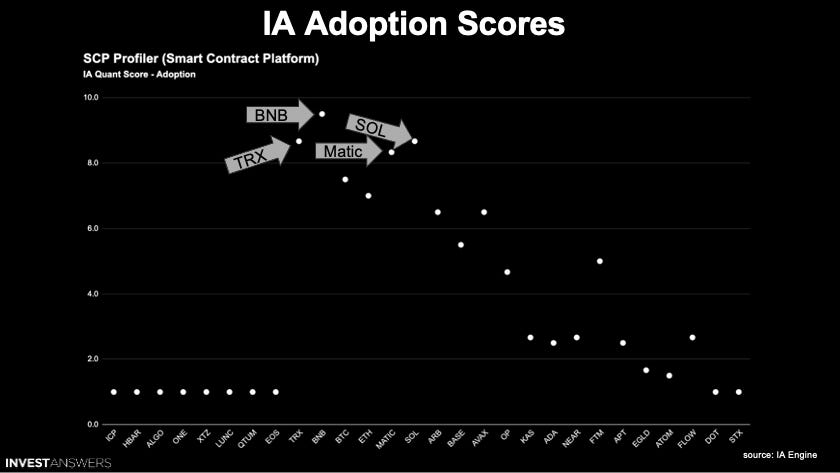
How quickly are the top chains growing?
BNB #1
TRX #2
SOL #3
MATIC #4
The Daily Active Users is all over the place as chains vary greatly.
ETH #1
MATIC #2
SOL #3
ARB is not the trend you want to see when it spikes, and then post-air drop dwindles away
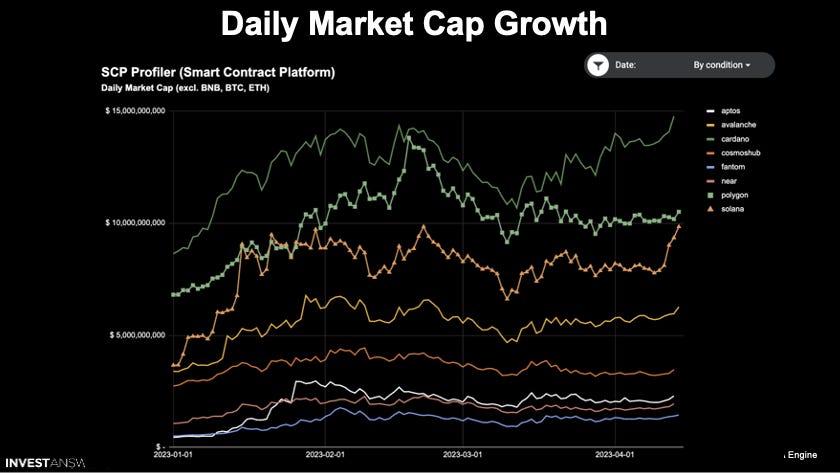
SOL is up ~150%
ADA is at the top of the market cap at $15B
MATIC is third but could be soon eclipsed by SOL
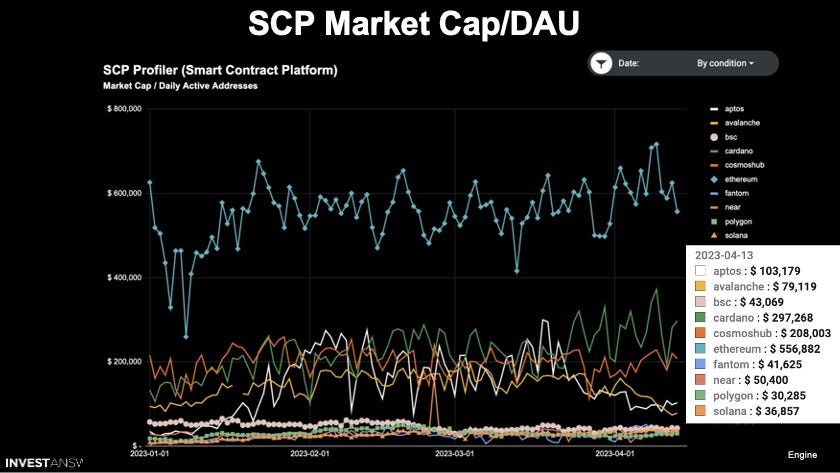
I started looking at this metric back in 2021, and now many people are beginning to adopt it, as this is how traditional companies measure themselves.
MATIC #1
SOL #2
FTM #3
BNB #4
ETH is $556,882 per daily active user because Ethereum is a platform on which a lot of stuff is built on top of.
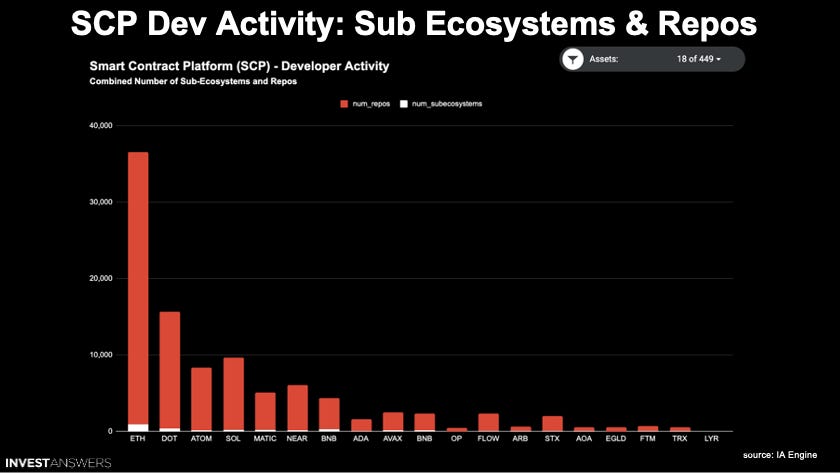
The clear winner is ETH in this category, followed by Polkadot and Solana
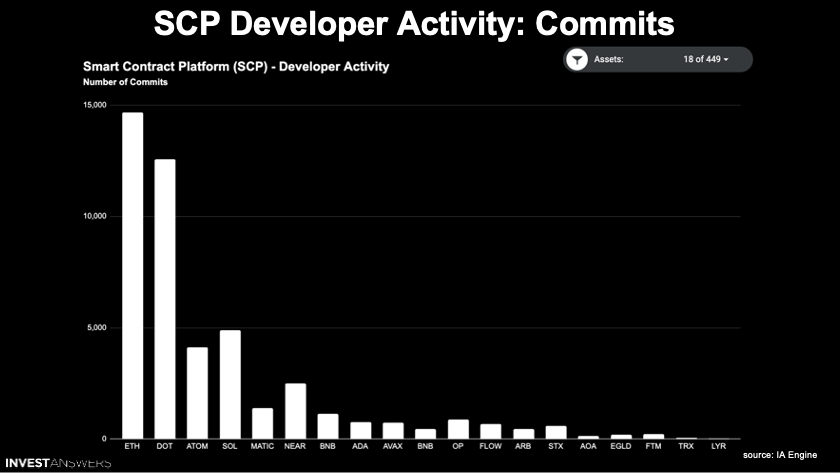
ETH #1
DOT #2
SOL #3
ATOM #4

For the Market Cap / Total Value Locked, we are looking for low ratios (far left):
ARB / OP / TRON #1
FTM #2
Polkadot has essentially no value locked on its chain.
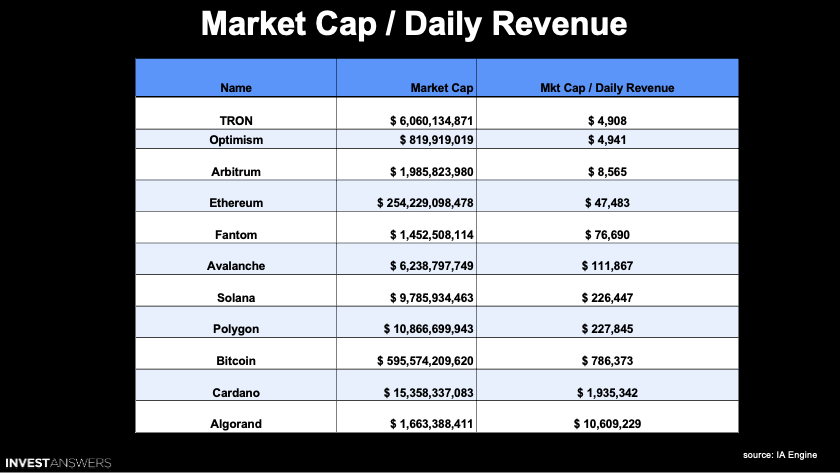
TRON, Optimism, and Arbitrum are making a lot of money based on their market cap.

This is not intended to offend anyone, just sharing the data and metrics.

Here is our Smart Platform Contract scorecard with the first through third in each category filled in on the grid.
SOL #1
MATIC #2
ETH #3
👋 JOIN THE FAMILY: http://www.patreon.com/investanswers
📈 IA MODELS: http://www.investanswers.io