


TODAY’S TAKE
QQQ is up 5.76% YTD, whereas BTC is up 24.72% YTD
Ethereum price is mean reverting against Bitcoin’s valuation
Rounded bottoms in the Bitcoin reserve risk indicate end of the bear market
The Graph (GRT) has risen 55% over the past week, 300% YTD
Risk-on and tech are back
Google announces Bard, a ChatGPT rival
Crpto total investment assets under management have risen 39% YTD
Cytpo market has moved into Altcoin Season over the last 90 days
Bitcoin daily active addresses experienced bump due to NFTs
Bitcoin Realize Profit/Loss Ratio signals bullish sentiment moving forward
Crypto small caps are crushing it YTD
Crypto winners will come from “product-market fit”
Per JPMorgan survey, institutional traders believe blockchain technologies will become more mainstream
Crypto experienced the largest increase in products being traded amount institutions
The U.S. is at the end of this rate hiking cycle, pivot is not far away
Globalization peaked 15 years ago
U.S. layoffs ramping up, moving from technology to other industries

During last week’s OCTA, I had a typo in my slide:
Correct: 100K Sats = US$23.63
Error: 100K Sats = US$3.63
The rest of the study’s math was accurate.

ETH rebounded well, up 5.72%, and mean reverting against Bitcoin
SOL is slightly red for the week
Most other altcoins are up against Bitcoin
OKB has sprung out of nowhere
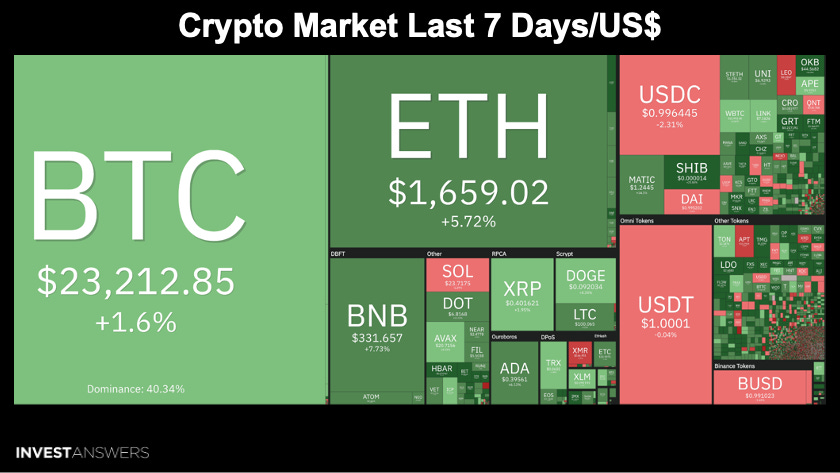
BTC continues its upward trend
BNB is up over 7.73%, mean reverting against BTC

Recently, QQQ fell slightly and is only up 5.76% YTD, whereas BTC is up 24.72%.

Here is a slightly modified glassnode’s Bitcoin reserve risk chart (added the red circular bottoms):
Higher values indicate both price and HODLer spending are elevated
Lower values indicate both price and HODLer spending are declining
A structural change in the trend appears to be underway as this oscillator approaches its equilibrium position (with 55% of all trading days below the current value). This suggests that the opportunity cost of HODLing is decreasing while the incentive to sell is increasing.
More important is the pattern I added to the glass node chart, which I refer to as rounded bottoms:
2012 end of the bear market
2015 end of the bear market
2019 end of the bear market
and now 2023
The width and depth of the rounded bottoms are very similar over time.
When investors realize net profits on their trades, they begin to sell. This strongly indicates that we are coming out of the bear market.
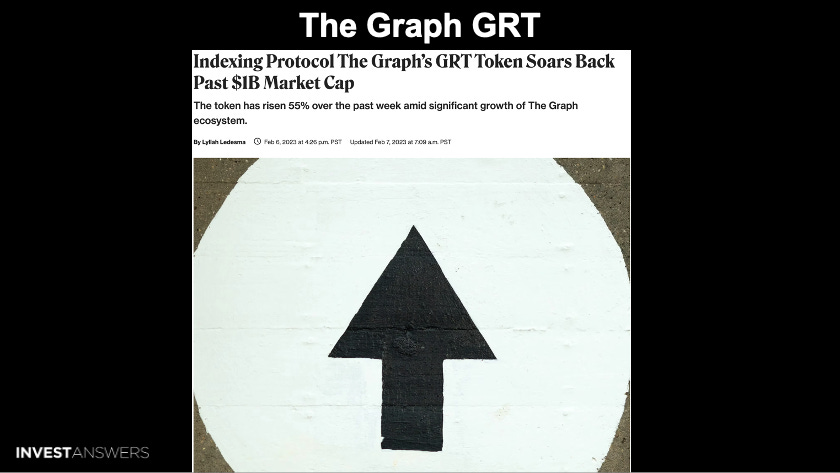
According to CoinMarketCap, the spike reflects the platform’s significant ecosystem growth in 2022, particularly during the fourth quarter.
The Graph removes the need for data consumers like app developers to expand complex infrastructure for gathering on-chain data. It supports indexing data from 26 blockchain networks, including Ethereum, Near, Arbitrium, Optimism, Polygon, Avalanche, Celo, Fantom, Moonbeam, and IPFS.

Per the IA ATR Model (coming later this year), the GRT was my top risk-reward pick for 2023. If we get back to half of the crypto market’s all-time high, GRT’s return is forecasted to be 1400%.

CoinMarketCap’s rankings of the “most valuable AI and big data crypto projects and tokens” currently has The Graph as the leading platform in market capitalization.
Some analysts also attributed GRT’s rally to its link to Artificial Intelligence (AI) related tokens, which have been surging recently due to the ChatGPT effect. According to Pablo Jodar, a crypto analyst at GenTwo, “I think it is linked to the rally on AI stocks due to the ChatGPT effect.”
In addition, the tokenomics have significantly improved since I first studied them in 2021. The platform raised $50 million in a funding round that Tiger Global Management led in January 2022.
“Do not chase and replace” after this 300% move.
Keep reading with a 7-day free trial
Subscribe to InvestAnswers Newsletter to keep reading this post and get 7 days of free access to the full post archives.