


Today’s Take
indeed.com indicates job listings are plummeting in the U.S.
Big tech is sitting on massive cash positions but conducting major layoffs
Year-over-year economic leading indicators are declining
KB homes are experiencing a 68% cancellation rate for new homes
In crypto, trade liquidity can vary greatly from a coin’s total market cap
USDT is now 49% of the stablecoin market cap
Apple is extremely dependent on the iPhone, making up over half of its sales
Apple's mixed reality headset might be the next-gen device to diversify revenue
Gold’s valuation has increased in direct proportion to the M2 supply over the last 52 years
Bitcoin’s volatility has been lower than big tech stocks over the last 12 months
Bitcoin long-term holders’ supply continues to grow, thus, reducing volatility
Bitcoin supply on exchanges remains in a downward trend
SOL is up 146% year-to-date with a market capitalization of roughly US$9B
Layer-1 ecosystem’s total value locked has also ticked 28% higher to US$321M

This is the market divided by Bitcoin, demonstrating how strong BTC has performed over the last week.

This was a big week for many in the crypto market, with almost all projects strengthening against the USD.

This week technology returned to a solid growth trend.
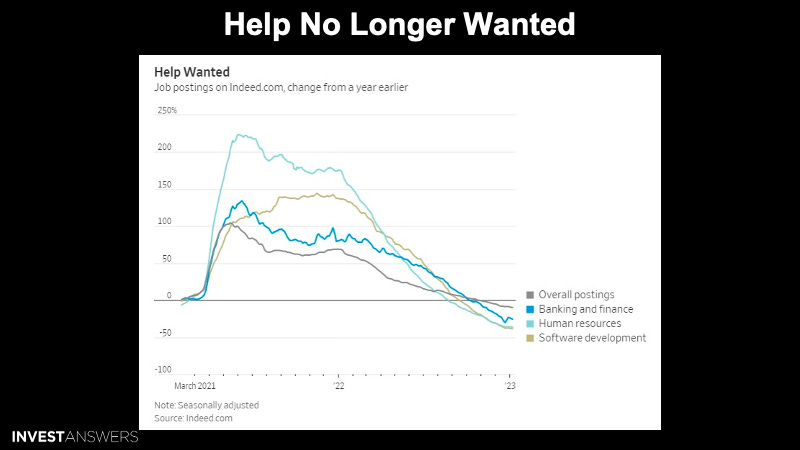
Per indeed.com, job listings are plummeting in the U.S.
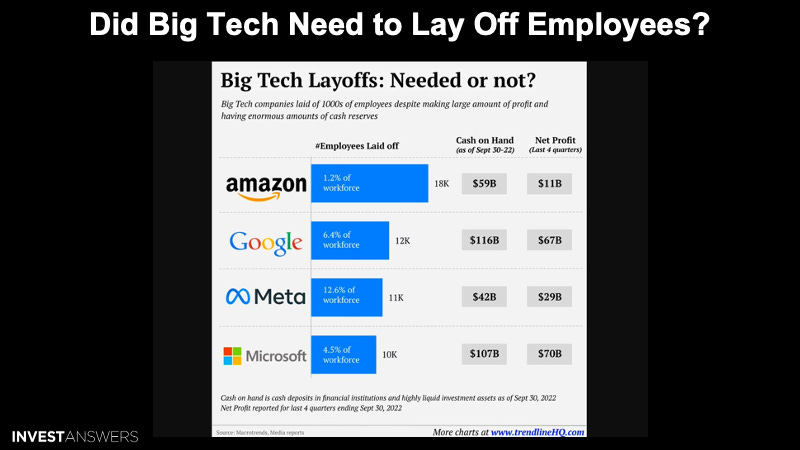
These big tech companies are sitting on massive cash positions; however, all are announcing significant layoffs.
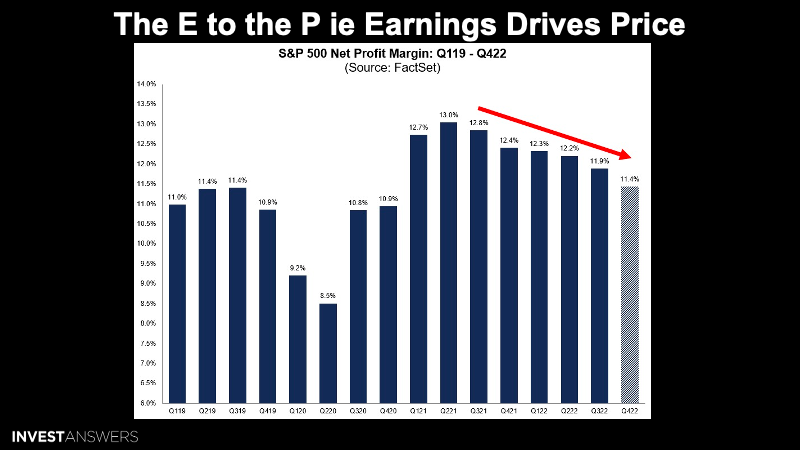
The peak in the net profit margin for the S&P 500 occurred in Q1 ‘19 at around 13% and has been declining ever since. When the earnings fall, then the stock prices decline.

The Conference Board’s leading economic index also presages a similarly dark economic outlook. The index is a compilation of 10 indicators that have historically led to recessions. They include the yield curve's shape, interest rate-sensitive manufacturing, housing activity measures, and labor market indicators. When the index falls sharply on a year-over-year basis, as is now the case, recession follows six to 12 months later.
While the index fell for the tenth consecutive month in December, the year-over-year decline is still not as sharp as that seen during prior downturns.

The economic leading indicators’ year-over-year is declining (blue), which does not bode well for forward real GDP growth (orange).

The SP Global Purchasing Managers' Composite Output Index measures the health of the manufacturing and service sectors of the economy. It is important because it provides a broad and up-to-date snapshot of the overall economic activity, which can be used to make informed decisions about investments, business operations, and monetary policy.
The composite index is based on five sub-indices:
new orders
output
employment
suppliers' delivery times
stocks of purchases
A reading above 50 indicates an expansion of activity, while a reading below 50 indicates a contraction. A higher reading generally suggests that the economy is growing.
In January, the S&P Global PMI was up to 46.6 vs. 46.4 estimates and 45 in the prior report.
Manufacturing PMI was up to 46.8 vs. 46 estimates and 46.2 in the prior report.
Services PMI up to 46.6 vs. 45 estimates and 44.7 prior in the prior report.
Companies continued to highlight subdued customer demand and the impact of high inflation on spending.
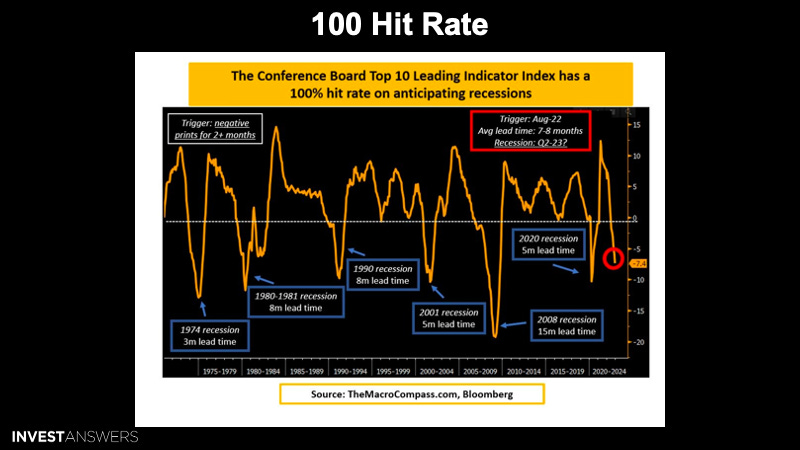
The new lows were recently reported for the US Leading Indicator index. According to @MacroAlf, this indicator has a 100% hit rate on anticipating recessions with a 7-8 months lag. This points to a recession starting in Q2 and on par with the 2001 recession.

This is a scary report from KB Homes, a large home builder in the U.S., which reported a 68% cancellation rate for new homes in the U.S. This means that over 2/3 of Homebuyers walked away from their contracts in the quarter. Last year the cancellation rate was only 13%.
The Federal Reserve has destroyed the housing market, real estate market, millions of jobs, trillions of wealth, and manufacturing orders. Is the job done yet? While exploding the U.S. deficit, causing no tax revenue from capital gains in 2022, and driving an even higher debt ceiling.
Keep reading with a 7-day free trial
Subscribe to InvestAnswers Newsletter to keep reading this post and get 7 days of free access to the full post archives.