


TODAY’S TAKE
Determining layers to take profits is critical to your investment plans
Critical to allocate according to risk and reward balance
If you had HODL’d the Retire on Crypto portfolio would have been down 15.35% over the last 606 days
MATIC and SOL were the only two profitable positions in the portfolio after 606 days
We will walk through my 2 base layer-out methods - both performed consistently better against holding across all tokens
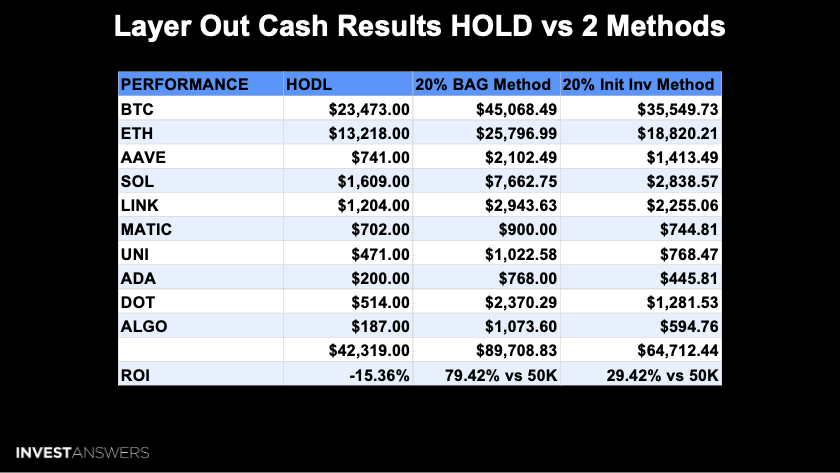
79.42% was made by layering out 1/5th of the total position method
29.42% gain if you executed the initial investment method ie recoup 20% of your original cash outlay per position.
Layer Out Model consistently performed better than holding only

606 days later, this is the original IA Retire on Crypto portfolio. As you can see, only 2 were above zero return. Stunning to see my so-called LO RISK Bitcoin underperforming my L1 L2 play.
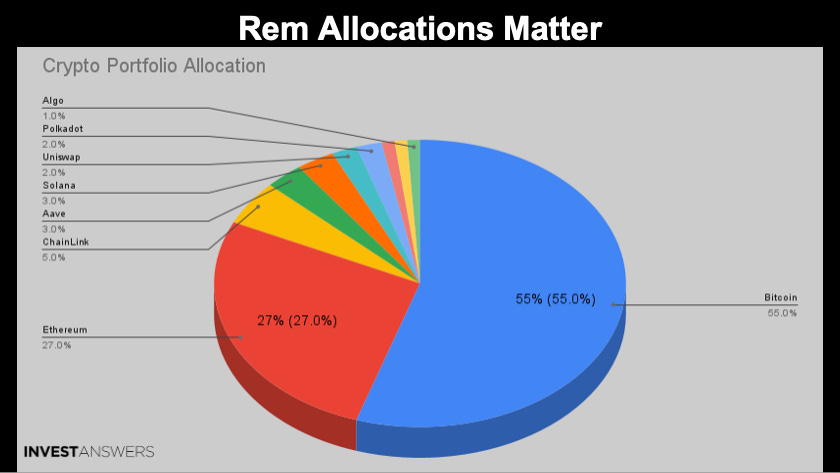
You have to allocate according to risk and reward. Investing evenly or all in one basket is not wise.
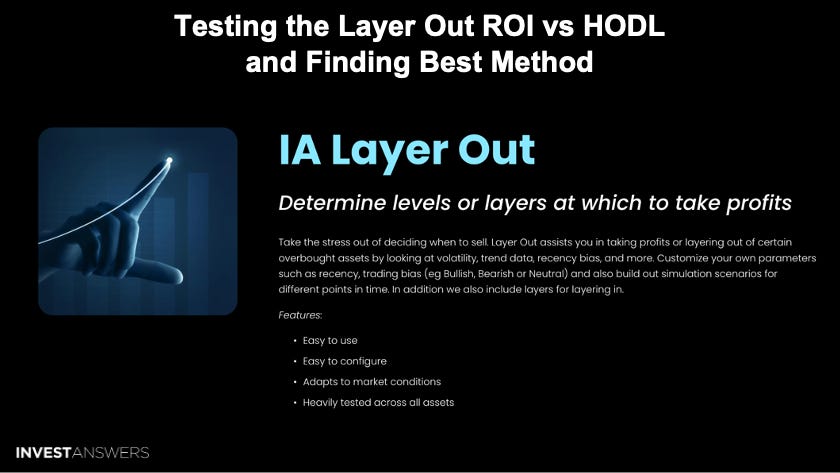
The Layer Out Model was designed after an idea I had in the 90’s - I never had the ability to model it out in real-time across different timeframes as the tech did not exist at the time so doing it manually was painful.
The 2 methods of layering out we will review:
Method 1 - sell 20% of your total holdings for each layer eg you hold 1 Bitcoin - you sell 0.2 BTC per layer.
Method 2 - sell 20% of your original investment recouped for each layer eg invest $1,000 - sell $200 worth of Bitcoin per layer.
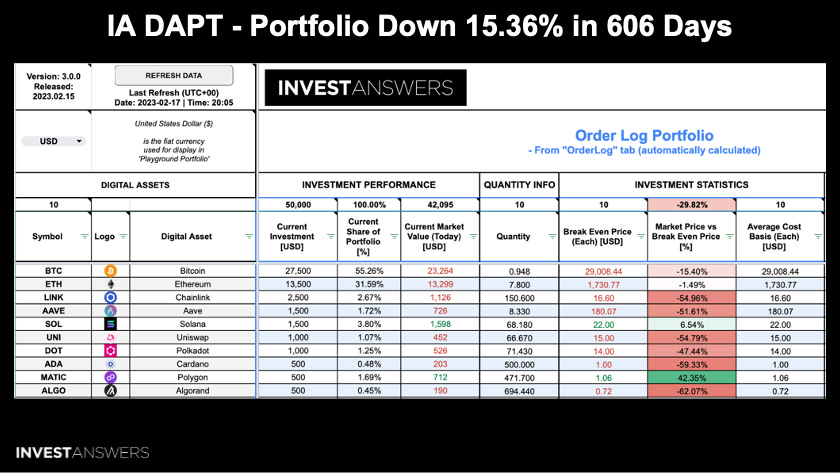
The HODL portfolio was down 15.36% during this brutal bear market. Our Digital Asset Portfolio Tracker (DAPT) model available on Patreon illustrates this. Note DAPT can be used to track not only all your buys and sells and portfolio, but you can also add portfolios of others and see how they compare. It also includes all key coin metrics and resources updated in real time.
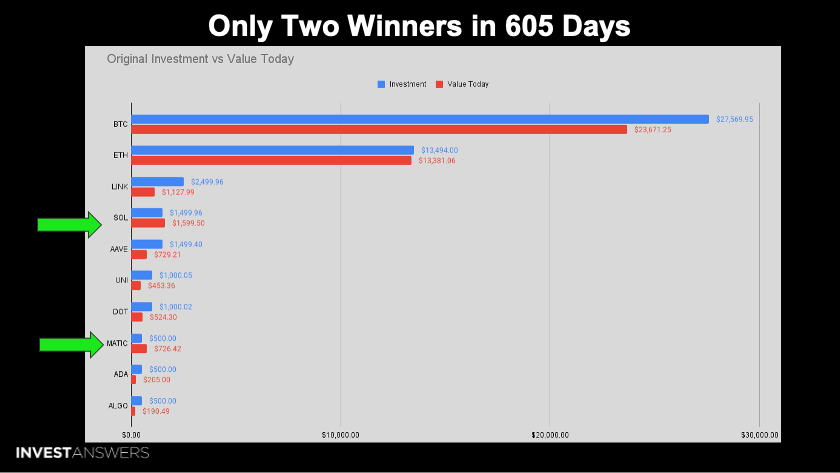
MATIC and SOL are the only winners in the portfolio over this period. MATIC was the super star and dealt with the bear very well. Solana broke even despite all the hits from SBF/FTX debacle and the litany of FUD.

Let’s explore if we can build a system to maximize our profit so we do not leave money on the table again.
What goes into calculating the layers?
TA Metrics
Sharpe ratio
Volatility
Trend Models
Time frames
If you did not see yesterday’s video, here is a link:
This is the Layer Out for Bitcoin all default per the Anchor Date of June 22, 2021. This was the same date used for all assets. Cynics will say it was fixed but any user of the tool can see for themselves. They will also quicky discover it is not FIBONACCI:


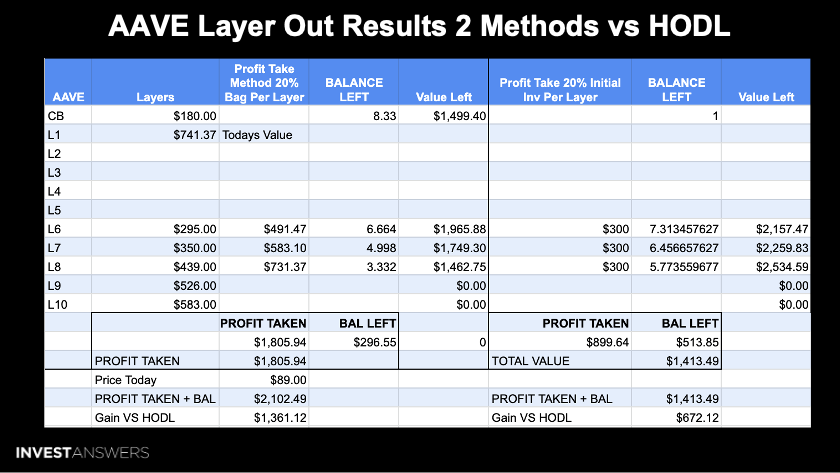
These calculations assume that all of the profit-taking proceeds are held in cash. Of course, we would reallocate this into other investments after layering out.
In summary HOLDING Bitcoin over the last 606 days yielded $23,421.
Method 1 Layering out using the model took $40,378 profit off the table while retaining 0.19 Bitcoin. Value using model is $21,641 higher than HOLDING.
Method 2 Layering out using the model took $23,216 profit off the table while retaining 0.499 Bitcoin. Value using model is $12,113 higher than HOLDING.


The price today is under the price of $1,730 in June ‘21.
SOL hit all 5 layers - and even though it capped out at $165, we found out after the fact the evil people at Alameda manipulated Solana, and therefore the price was not representative of a true all-time high.


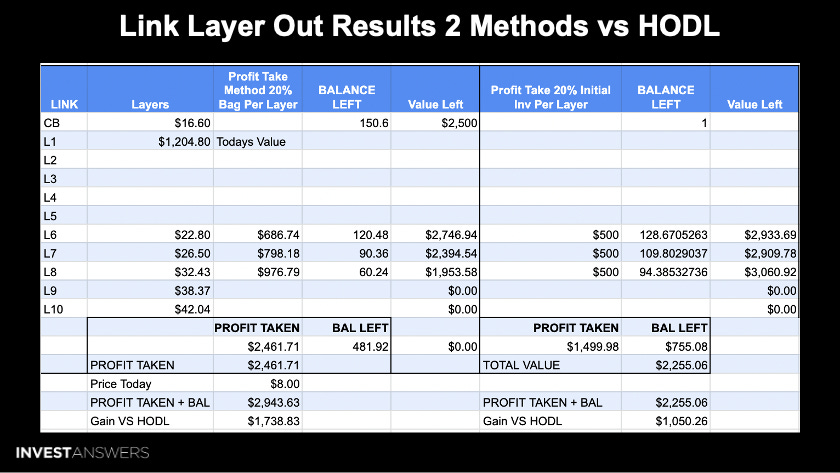
Chainlink, the biggest disappointment of the bear market, proves history often does not repeat. LINK did amazingly well during the bear of 2018 but not the bear of 2022.

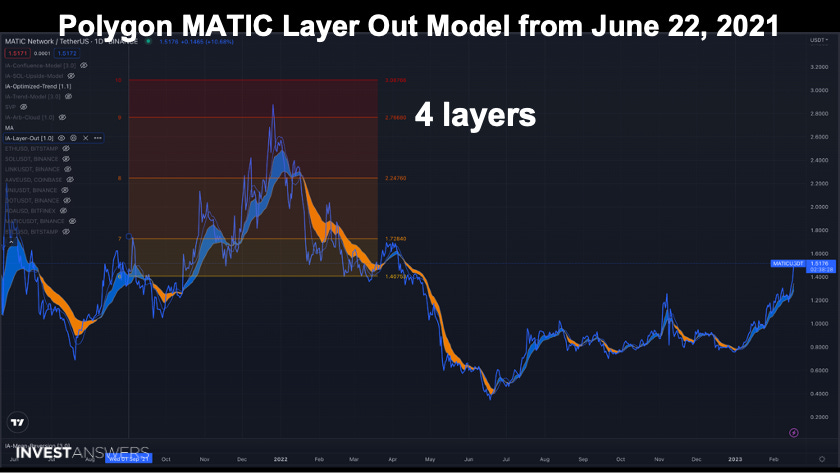
MATIC, the star of the bear, hit 4 of the 5 layers.
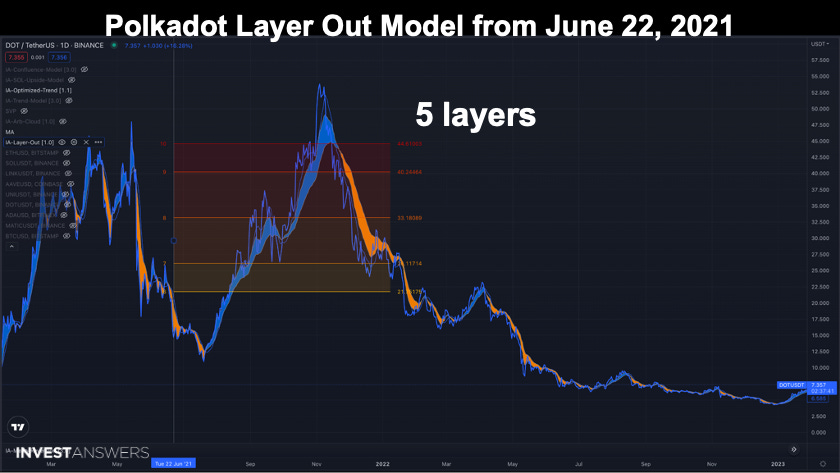
DOT hit all 5 layers.

ALGO hit all 5 layers also and it really shows the value of layering out when coins have bad tokenomics.


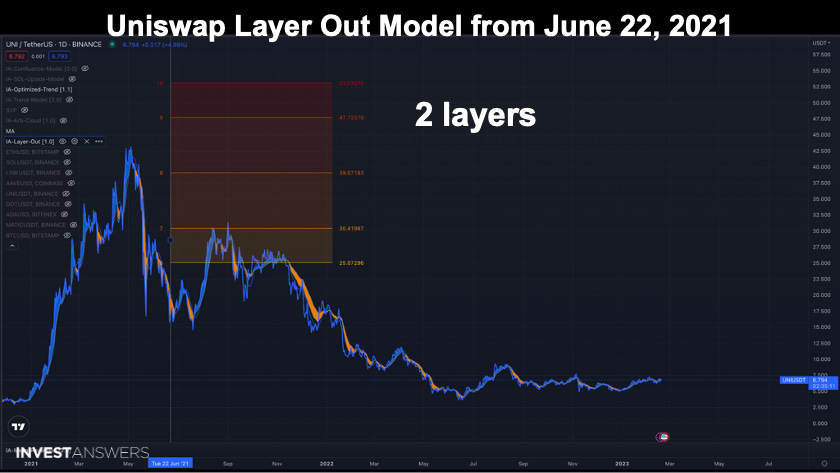
UNI ran before the true bull run. So it only hit 2 layers. Remember the Layer Out Model is designed to automatically identify exit levels of an asset using volatility, cost basis and historical trends. It uses Volatility (Sharpe Ratio) at points in time, in combination with the directional trends of an asset. You can configure the system for different data sets over points in time (recency) - Long, Medium, and Short range depending on your trading style. The model picks dynamic layer-out points for profit-taking and will also help you exit weak assets sooner and stay in strong assets longer.
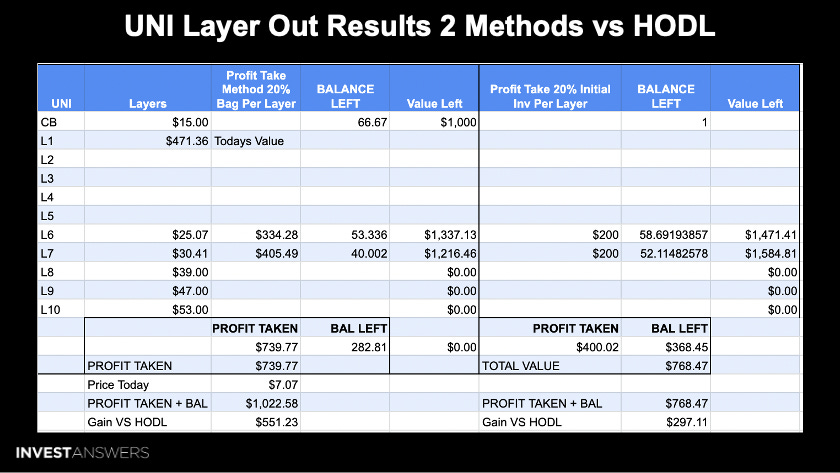
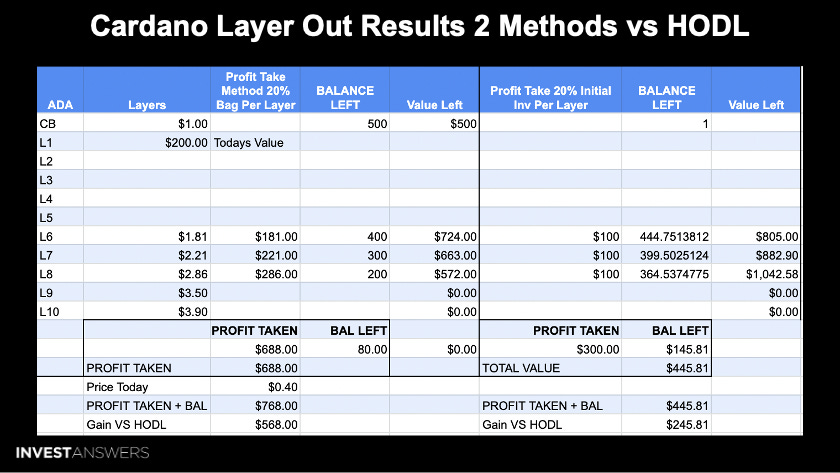
ADA only hit 3 layers, like UNI it ran early.

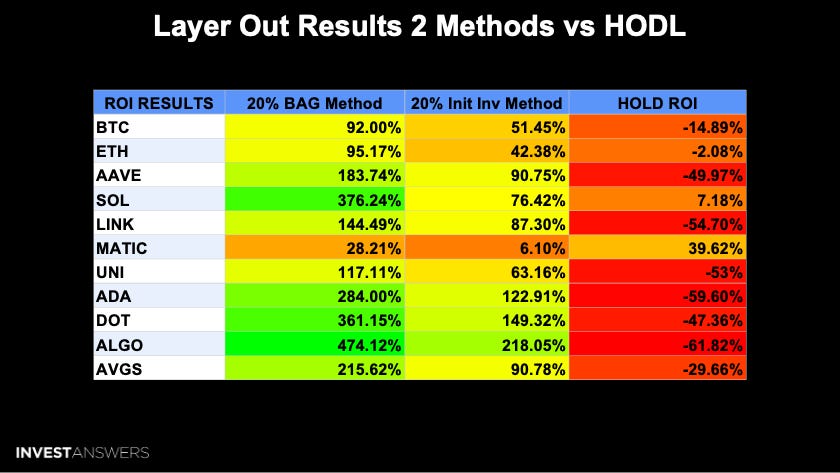
The chart is colored in relation to what strategy performed the best.
The winner is ALGO at 474.12% using the 20% bag method. Holding ALGO was the kiss of death.
Going into this study, I would have thought SOL would have come out on top due to its volatility in this cycle but once again the manipulation of SOL changed the game slightly.
Withdrawing the 20% of the initial investment method did not perform as well as selling 20% of the tokens - but it still beat HOLDING.
The holding method performance was awful. So JUST HODL is BS!

Utilizing either layer-out method, ie METHOD 1 - the 20% of the Bag method or METHOD 2 - pulling out 20% of the initial investment - the performance consistently beat ‘HODLing only’ throughout the last cycle.
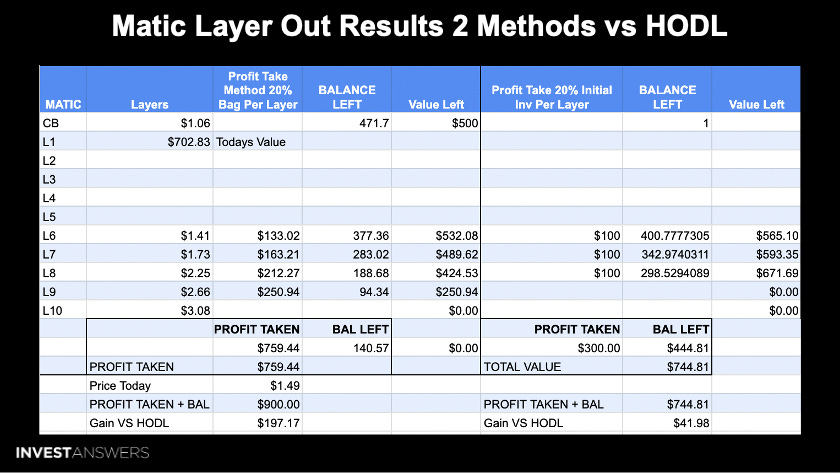
79.42% was made by layering out 1/5th of your total position at each layer for each investment.
29.42% gain if you executed the initial investment method.

Layer Out - Method 1 or Method 2 crushed HODL in every circumstance across every token.
When you compare Layer Out to the HODL portfolio and return you will see ROI’S of 112% and 53% compared the HODL balance of $42,319.

This is a stunning difference in portfolio performance.

I have a new method that will soon be revealed based on layers and load! Stay tuned to future IA Newsletters for more updates.
Learn more about Layer Out Model here.