


As I say, everything is a pair and my background is in pair trading. In this lesson, I'm excited to present the premier tool for enhancing a pair trading strategy, which focuses on trading pairs of inversely related assets: "Pair Trading on Steroids." This isn't just another tool; it's my top pick. And it's not simply because we're behind its creation, but because it fills a unique gap in the market — and remains unparalleled.
As we geared up for this lesson, we gathered frequently asked questions from the IA Patreon community The upcoming content aims to address these queries. Additionally, I'll guide you on its usage and share a nifty technique I often employ with it.
Let’s start by answering what Pair Trading on Steroids is all about. When one asset drops, its inversely related counterpart rises, enabling profits during both bullish and bearish market phases. This method enables traders to benefit by going long on an appreciating asset and subsequently shorting (or going long the inverse asset) as market dynamics shift. The strategy aims to optimize returns by pinpointing arbitrage chances and signals that suggest market direction changes.

In the IA Community we have an Optimal Pairs spreadsheet listing over 400 pairs that Pair Trading on Steroids has been verified to work with. For every asset, extending the timeframe for pair trading generally increases the likelihood of success with these models. For instance, trading on a 4-hour chart typically yields better win rates than a 1-hour chart. However, there are exceptions. To eliminate uncertainty regarding the best timeframe, we've included a backtest in the package.

Traders might choose to pair trade inversely correlated pairs because:
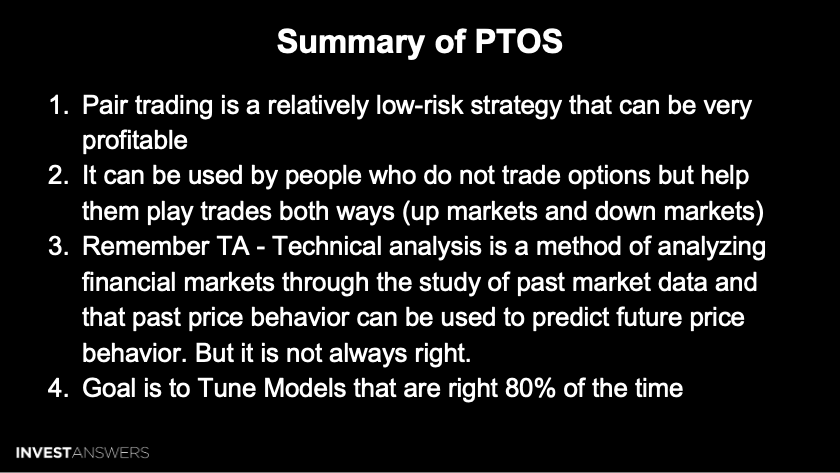
It is a relatively low-risk strategy. Since the two stocks in the pair are expected to move in opposite directions, you are only exposed to risk if both stocks move in the same direction.
It is a highly profitable strategy. If you can identify a pair of highly correlated and inversely correlated stocks, you can profit from the difference in price between the two stocks.
You can make money in both up and down market conditions.
This approach empowers you to capitalize as an asset rises and then short when market conditions change.

Pair Trading on Steroids comes with the Optimized Trend indicator. Our other model, IADSS, comes with both the Trend and the Optimized Trend indicator. The difference between "Trend" and "Optimized Trend Model":
Trend tells you when the trend is moving up or down. The optimal balance was found after 40,000 tests. Trend has a backtest to tell you the results on certain assets over certain times.
Optimized Trend is a bespoke Trend calculated per asset based on a number of calculated factors. It is unique to every asset and works across every asset class and every timeframe. This helps to identify when you need to stay in or out of the trade.
You need to discover what assets you like to play and get good at it. Then, you must identify the time series to backtest and paper trade it so you can discover your own rhythm to be successful ie pick your assets and pick your style eg scalper, day trader, swing trader etc.

Pair Trading on Steroids, or what we call PTOS for short, is all about timing your trades.
Once you have identified a few pairs of stocks that are highly correlated and inversely correlated, you can backtest the strategy to see how it has performed in the past. Backtesting is a process of simulating trades using historical data. This allows you to see how the strategy would have performed in the past and to identify any potential risks.
Check out the live lesson on Pair Trading on Steroids from 05:00 to 15:10 by clicking here.
Notes on the process for implementing PTOS in TradingView:
Create a Watchlist referencing the IA Optimal Pairs spreadsheet (available in the IA Community forum which you gain access to with any subscription of an IA Indicator) of all the pair trading assets so you know exactly which assets you want to play
Start with the bottom indicator entitled IA-PTOS-Model settings and input the "Comparison Asset" from your watchlist. Then click the "Style" tab and make sure that the Upper Bound (+2.00 by default) and Lower Bound standard deviations are proportional (-2.00 by default).
Next, with a top indicator entitled IA-PTOS-Signals, configure its settings:
Lookback Period: should match the input in the IA-PTOS-Model (default 60 days)
Show Backtest: True by default
Entry Type: % Current Capital I like to use 33% of capital devoted to this asset
Exit Type: LIFO - Last In First Out at 33% of capital devoted to this asset
The IA-PTOS-Model displays the standard deviations from the mean. It plots the inverse relationship between the two assets, which must be inversely correlated.
TSLA:TSLQ Demo Notes:
The best example used in our community is the TSLA and TSLQ pair. The model looks back at history to identify the perfect arbitrage times to swap between the long position of TSLA (spot Tesla stock) and the bear ETF TSLQ. TSLQ is a single-stock exchange-traded fund that seeks to produce the inverse daily performance of Tesla stock. Like other inverse ETFs, TSLQ attempts to deliver positive returns when its benchmark produces negative returns. For TSLA, if it goes below -2.00, then it is an optimal buy signal.
BITI:BITO Demo Notes:
The IA-PTOS-Model signal is confirmed by a green flag (long or buy) at the top in the price chart. This signal is confirmed by a change in the IA-Optimized-Trend that flips from orange to blue. When it is blue, you go long. When it is orange, you do not.
When the IA-PTOS-Signals supplies a red short flag, this is when you sell the underlying long position (ex. BITO) and buy the inversely correlated pair (ex. BITI). This allows the investor to profit from the swings in the price movement of the BTC asset.
NVDA:NVDS Demo Notes:
NVDS is the inverse asset to NVDA.
It is essential to always confirm the "Comparison Asset" and "Lookback Period" in the IA-PTOS-Model and the IA-PTOS-Signals.
The more frequently you trade (period in the price chart on TradingView), the more you need to dial in your standard deviation (IA-PTOS-Model's "Upper & Lower Bound" settings under the Style tab) to eliminate the noise from the signal. I prefer using a 4-hour chart because it helps back up the probability of winning.

PTOS is ideal for accounts that are tax free but work very well for those that are not. You never go broke paying taxes as I say. This next section is for more advanced traders (and is best if paired with a tax-free retirement account to amplify your gains). One such strategy is trading the QQQ (Nasdaq top 100) and the PSQ.
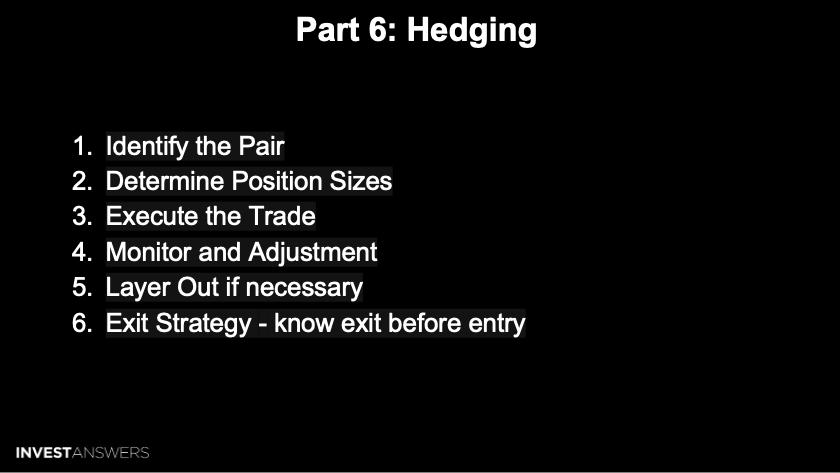
PTOS can also be used as a hedge position, so you do not have to get out. For example, if you are long Bitcoin but you feel there could be a one-month dip, you can use this tool to hedge without selling your underlying position and exposing yourself to capital gains.

With equities, sometimes I use PTOS to sell calls at tops, but I do not sell puts.

If you buy NVDS, you must remember that it is a 1.25x short, so you make sure to account for it and trade proportionally to your original long position.

In the video, I show an ETF example and how it works 100% in any timeframe.

Pair trading with futures on inversely correlated assets opens up avenues for potential gains. Depending on market projections, you can use long and short futures contracts to generate alpha or hedge your positions.
Identify Inversely Correlated Assets: Before initiating any trades, you'll want to identify two assets that are inversely correlated. This means when one asset's price goes up, the other's price goes down, and vice versa.
Implementing the Strategy:
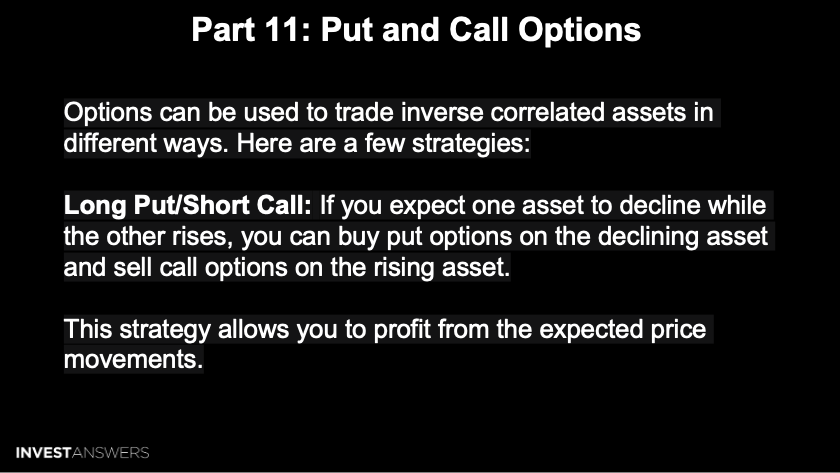
Long on Asset A / Short on Asset B:
Buy a call option on Asset A, anticipating its price to rise.
Buy a put option on Asset B, anticipating its price to fall.
Short on Asset A / Long on Asset B:
Buy a put option on Asset A, anticipating its price to fall.
Buy a call option on Asset B, anticipating its price to rise.

Purchasing both a call and a put option with identical strike prices and expiry dates is a strategy that capitalizes on substantial price shifts in any direction. If you anticipate one asset to sharply increase and the other to decrease, employing a long straddle can help seize those potential fluctuations.

Buying and selling options of the same type on the same underlying asset but with different strike prices:
Bull Put Spread: This is an options strategy that involves buying a put option at a higher strike price and selling another put option at a lower strike price (both with the same expiration date). This strategy is used when a trader expects a moderate rise in the price of the underlying asset. The profit is limited to the premium received from selling the lower strike put minus the cost of buying the higher strike put. The risk is also limited to the difference between the two strike prices minus the net premium received.
Bear Call Spread: This is a strategy that involves buying a call option at a higher strike price and selling another call option at a lower strike price (again, both with the same expiration date). This strategy is used when a trader expects a moderate decline in the price of the underlying asset. The profit is limited to the premium received from selling the lower strike call minus the cost of buying the higher strike call. The risk, similar to the bull put spread, is limited.
Check out the below demos by clicking here and navigating to timestamps 18:15 to 24:00)
SOLUSD Demo:
This provides a great example of why dialing in the optimal time period on the charts per asset is essential. As in this case, the 2-hour chart provides a much higher probability of winning over the daily or 4-hour.
Remember that every asset mean reverts in trading, so you wait for confluence among all the signals: Optimized Trend, PTO Signals, and PTOS Model (based on the standard deviations you select).
TSLA Demo:
The 1-hour chart supplies an 89% win rate. Tesla tends to be weak in the morning and stronger in the afternoon. So you go long in the morning and get out in the afternoon.
ProShares Ultra Health Care (ARCA) Demo:
This one is interesting because no matter what period you select, you will win at 100%. This asset supplies a perfect range rider ideal for PTOS to supply a highly probable trading pair.
PTOS Questions:
Does PTOS require the capital to be used on the same exchange to execute your trades?
It is better to be on the same exchange so you can move fast. In most cases, the exchange will house both the long and short options, like the SOL 3x products we demoed on gate.io.
I cannot swap a stock for another on Fidelity, which means I take a tax hit…any recommendations?
Anytime you trade, you are going to take a tax hit. So, that is why it is good to trade inside of a retirement account.
Can you summarize the consecutive indicators of when to buy versus sell?
Always start with the four-hour chart and then go up and down from there to improve your odds of winning.
Start with the IA-PTOS-Model hitting the defined standard deviation level you set for the selected asset pair. This is the model that looks at the inverse pair. When the model gets under the standard deviation set (ex. 2.0), it is your first indication to buy the underlying asset (ex. TSLA).
Then, you wait for the IA-PTOS-Signals to supply a green buy/log upward flag on the price chart.
Then, you wait for the Optimized Trend to turn from an Orange to a Blue color.
You then reverse this process to identify a shorting or opportunity as an inversely correlated asset (ex. TSLQ).
Tip: The more standard deviations you get away from the mean, the more conviction you should have in your trade. The shaded green zones indicate buy zones, and the shaded red zones indicate sell zones, both of which need to be confirmed with the IA-PTOS signal and Optimized Trend.
Is there additional training and support with the tool subscription?
Our IA Community platform supplies community support and collaboration around these tools and strategies. Access to the IA Community forum is included with any subscription of an IA Indicator. We have a dedicated subsite on PTOS with user guides, video tutorials, technical support for the tool, and topical threads on how other users utilize PTOS. As many community members have said, the community alone is nearly as valuable as the tools.
