


Today’s Nuggets
14.2% of BTC Price Move is Attributed to?
The New BTC ETF Multiplier
New IA Investor Profiler Reveal
BTC ETFs are Losing Steam
Bull Market Correction Drawdowns
Japan to Drop the Maximum Tax Rate on Bitcoin
Pro-Bitcoin Candidate Set to Challenge the Anti-Crypto Army
CleanSpark Mining Update
We are eight months into these Bitcoin ETFs and I ask myself… what impact have they had on the price? How correlated are our flows to the price?
At the very beginning, the ETFs were very correlated to the BTC price to the tune of about 67% and I am wondering what that is now.

I shared this exactly a month ago on this Bitcoin Daily video. Shout out to Big Ed, who is featured in this photo. I understand that it is frustrating, but it is also funny. Yesterday, Bitcoin fell to ~$56,500, if I am not mistaken, and bounced right back up.
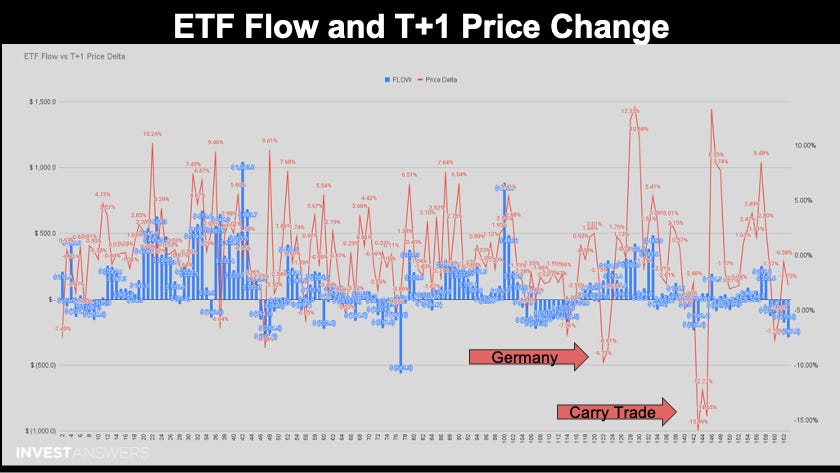
This is the ETF flow and the T+1 price change in percentage terms, with the numbers in millions of dollars. The blue lines are all the ETF's inflows since inception and the red lines are the percentage price changes.
We had some really interesting dips with outflows out of ETFs and very little impact on price and sometimes you had big inflows into ETFs and very little impact on price. Certain events, such as Germany selling, scared the crap out of Bitcoin holders.
We had the monster carry trade reversal that wicked us right down and things have happened on the macro side of the world that impacted Bitcoin's price.
The question is: how much do the ETF flows impact it?

This chart displays the correlation of how much the ETFs drive the actual Bitcoin price move. Basically, this is a scatter chart of every single correlation between every single event.
Initially, the correlation was much higher, so the price went up if the money went into the ETF but this has fallen a lot as of the last 30 to 50 days.
What is interesting now is that you can see in the bottom left quadrant 43 times the actual inflows have been positive, the price of Bitcoin has gone negative, and only 14.2% of the price action can be explained by the ETF flows.
Something has changed as the 5Gs sold, which has all interrupted this correlation.
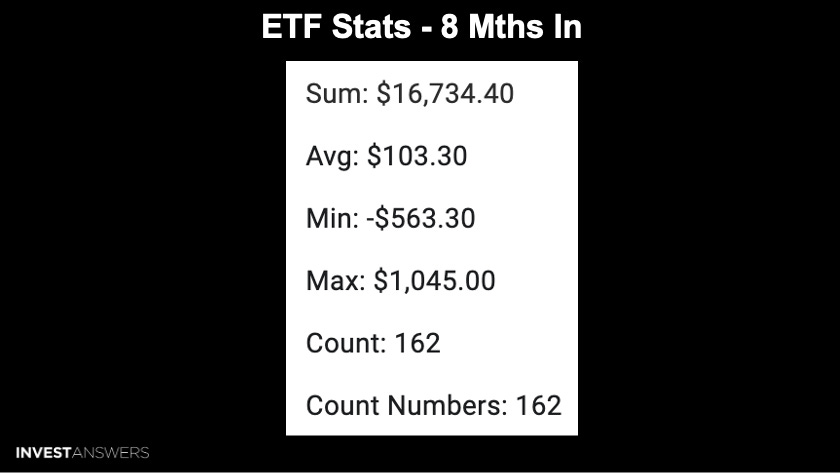
$16.734 billion has flowed in net to these ETFs.
This equals $103.3 million per day on average.
The worst day of outflows was minus $563 million.
The biggest day of inflows was $1.045 billion.
We now have 162 days in the bag.
What I want to do is try to figure out - mathematically - how my IA multiplier from years ago corresponds to this current environment.
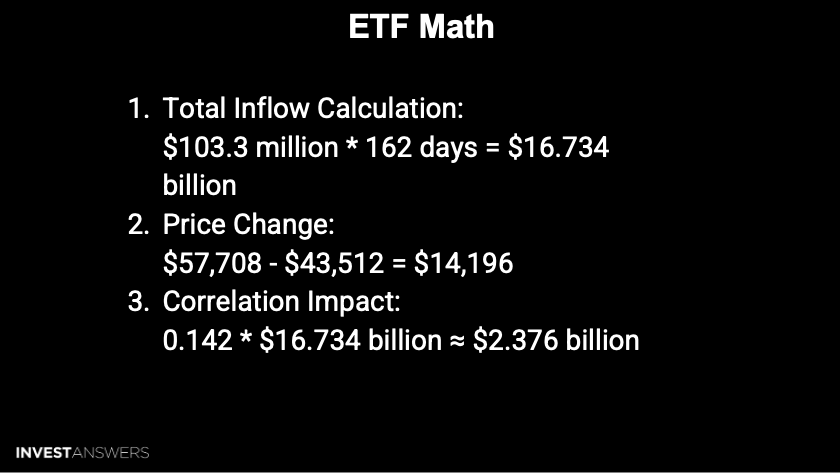
Let us call it $14,000 as the price change for Bitcoin over this ETF era.
Before the Bitcoin ETFs, $42,000 was my halving price target that did not take into account the ETFs. The ETFs, technically, per my models, have lifted the price over $14,000, so that 0.142 multiplied by the $16,734 billion is about a $2.376 billion impact.
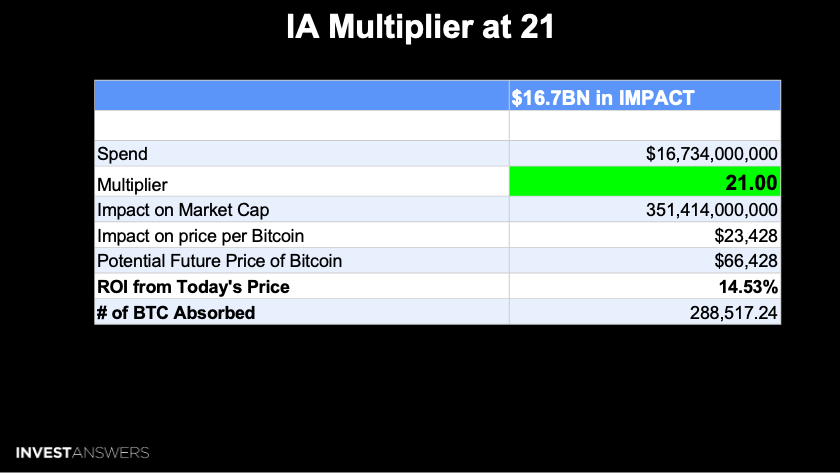
Since 2021, I have been talking about my 21x multiplier, which I backed into from the Tesla Bitcoin purchase, the impact of one and a half billion dollars invested.
By the way, Michael Saylor is issuing stock to buy $2 billion in Bitcoin, making it a great time to buy.
I know he is chomping at the bit right now…
This market cap multiplier of 15.3 is not 21, but remember, we are just talking about the ETFs.

If we assume the IA multiplier of 21, the price of Bitcoin should technically be at
Keep reading with a 7-day free trial
Subscribe to InvestAnswers Newsletter to keep reading this post and get 7 days of free access to the full post archives.