


TODAY’S TAKE
Nasdaq and Bitcoin’s performance continues to decouple
Crypto market goes higher after reclaiming 200-day moving average
March is best month to buy Bitcoin to capture annual gains
Bitcoin call options supply a bullish indicator through May 26th
The Difficulty Regression Model is a good indicator of a Bitcoin bull market
China pumping tons of new liquidity into the market
ETH gas experienced gradual increase since September ‘22
NFT recovery is underway, driving a lot of ETH action
U.S. buyers exiting the market for housing, cars, etc.
China is post-pandemic winner for vehicle exports
The Fed can only destroy demand

BTC beat almost all other projects’ performance in crypto last week.
Today we’ll cover what to expect in March and how things are lining up in the markets.
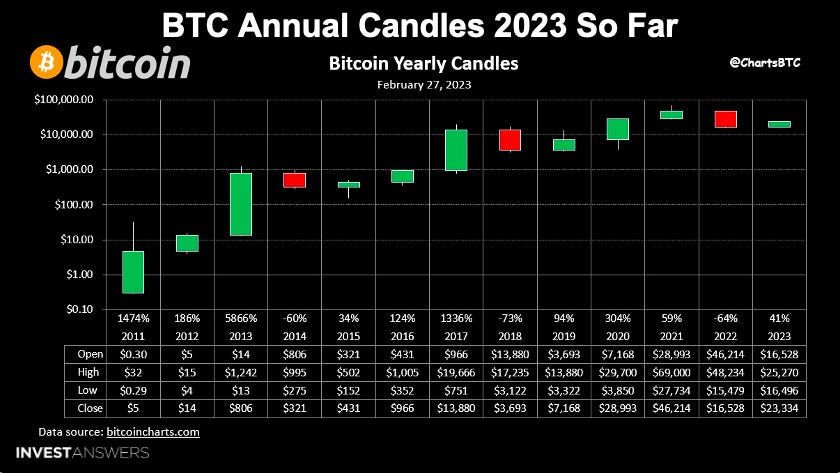
Per the annual candles, 2023 has been a great year so far.

This chart is a snapshot of the last 90 days, depicting the decoupling between BTC and QQQ. This is an important trend development for Bitcoin as an asset class.
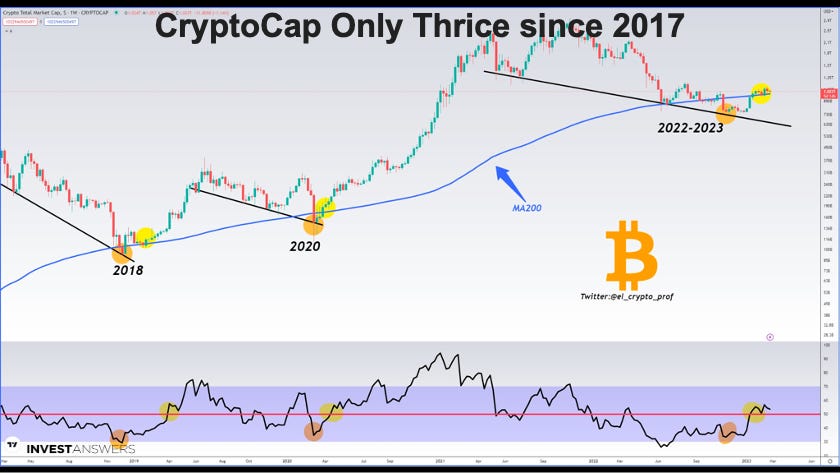
The total crypto market cap is going through the same scenario as 2018 and 2020. The critical line on the chart is the blue (🟦) 200-day moving average, and notice what happens to the price after it reclaims the MA200 after losing it. At the bottom, you can see that the Relative Strength Index (RSI) is above 50 simultaneously.
Per history, the crypto market goes higher after reclaiming the 200-day moving average.
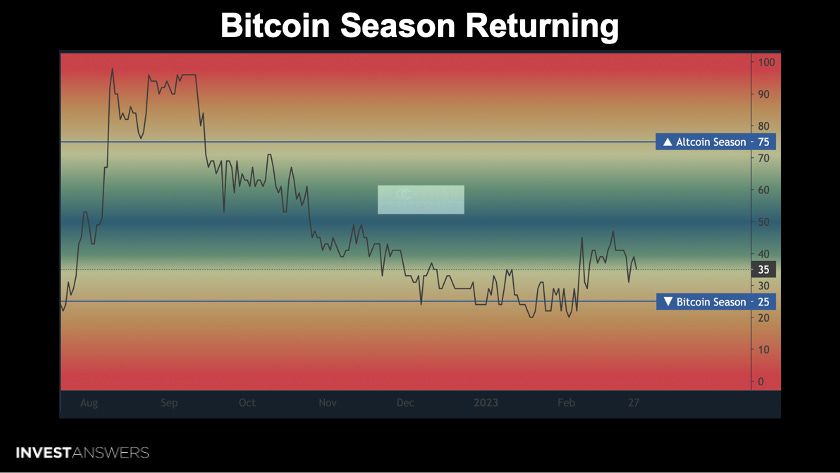
We cover this chart weekly and the trend started dipping back toward a Bitcoin season that would arrive at the 25 level.

The key number in terms of Bitcoin price action is to remain above US$22,800 to stay in the green for March. This is an important psychological chart for improving investor sentiment.
The red (🟥) horizontal barriers represent the three previous bear markets.
The cycle analog for 2023 would be 2019. Notice that April is the second-performing month on average in Bitcoin’s history. I mention this because you do not capture the gains in April unless you are on the train in March. Typically, March is the best month to buy because you achieve the greatest gains in the next 60-90 days.

This chart demonstrates that most traders are buying calls between the 25-30K target range. This is out to May 26, 2023, supplying another bullish indicator.
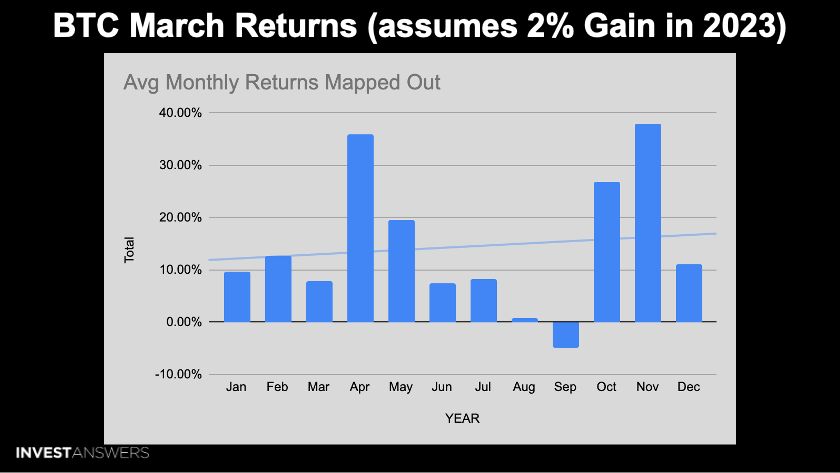
April has been good despite the so-called tax loss selling. Again, buying in March historically has resulted in good gains from April through May.

This chart illustrates that more Bitcoin has not moved in at least ten years than there is on exchanges currently. So again, the supply crunch is coming. We just do not know when.
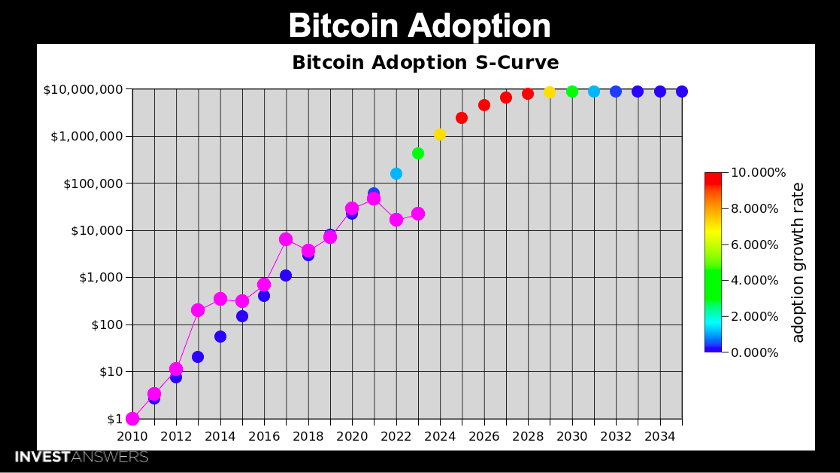
Here is the latest Bitcoin adoption S-Curve model from Plan B based on Metcalfe’s law.
The purple (🟪) has, for most of Bitcoin’s history, been above the line derived from Metcalfe’s law (adoption of the network). Since we are currently significantly under this trend line would indicate that Bitcoin is presently trading below fair market value.
Plan B believes diminishing returns will not start until we hit 50% plus adoption.

The Difficulty Regression Model is an estimated all-in-cost of production for Bitcoin. This is a good indicator of a bear and bull market.
The value reflects an estimated production cost of US$21,100. As the price is above the DRM, miners have come back online, hash rate exploded.
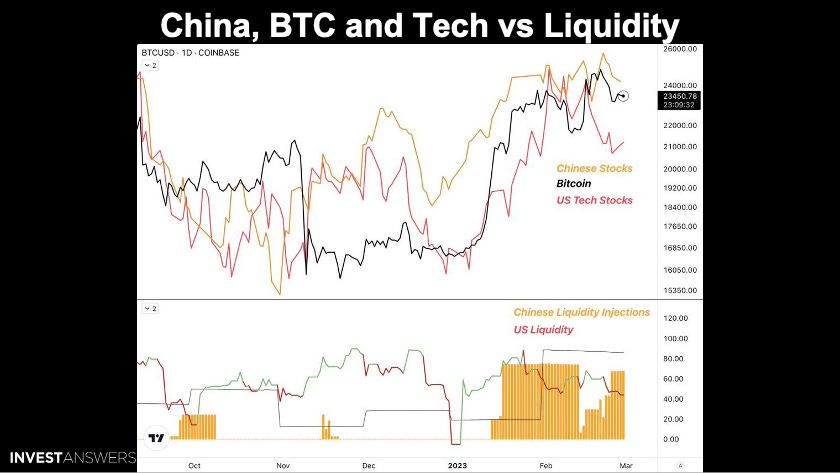
The Bitcoin price sits right in between Chinese stocks and U.S. tech stocks.
U.S. liquidity is drying up, but China is pumping tons of new liquidity into the market. China's central bank performed its single-largest liquidity injection last Friday to help support its economy out of historically depressed levels. This is a counterweight for crypto and will also fuel Chinese stocks.
With Hong Kong opening up to crypto in May, this could be the gateway for Chinese investors to enter the space.

We all know that when new liquidity enters the market, price action goes up for Bitcoin.

Digital asset investment products saw minor outflows totaling US$2M. Although this masks broader negative sentiment as the largest inflows were into short investment products.

Opinions remain polarized, with the U.S. seeing outflows totaling US$14M. Recent macro data has increased fears amongst investors that the US Federal Reserve (FED) will be more hawkish than expected.
Bitcoin saw outflows for the 3rd consecutive week totaling US$12M, while short-bitcoin saw inflows totaling US$10M, although this negative sentiment was solely from the US. We believe this reaction reflects nervousness amongst U.S. investors prompted by the recent stronger-than-expected macro data releases but also highlights its sensitivity to the regulatory crackdown in the U.S.
Interestingly, Ethereum has remained relatively insulated from the recent negative sentiment, seeing only US$0.2M of outflows last week. Minor inflows were seen in Polygon, Solana, and Cardano, totaling US$0.6M, US$0.5M, and US$0.4m, respectively.

Bitcoin is beginning to move up the charts and strengthening against altcoins. The explosive growth has taken place in the new Layer 1s.
Remember, never chase, replace.
If you are investing in a project, make sure there are users and utility.

The frequent altcoin rotations lead the Small Cap Index to maintain its strength versus the rest of the market. BTC and the other indexes have moved in tight correlation throughout the past month, whereas Small Caps experience excess returns fueled by rotations into emerging narratives.
Keep reading with a 7-day free trial
Subscribe to InvestAnswers Newsletter to keep reading this post and get 7 days of free access to the full post archives.