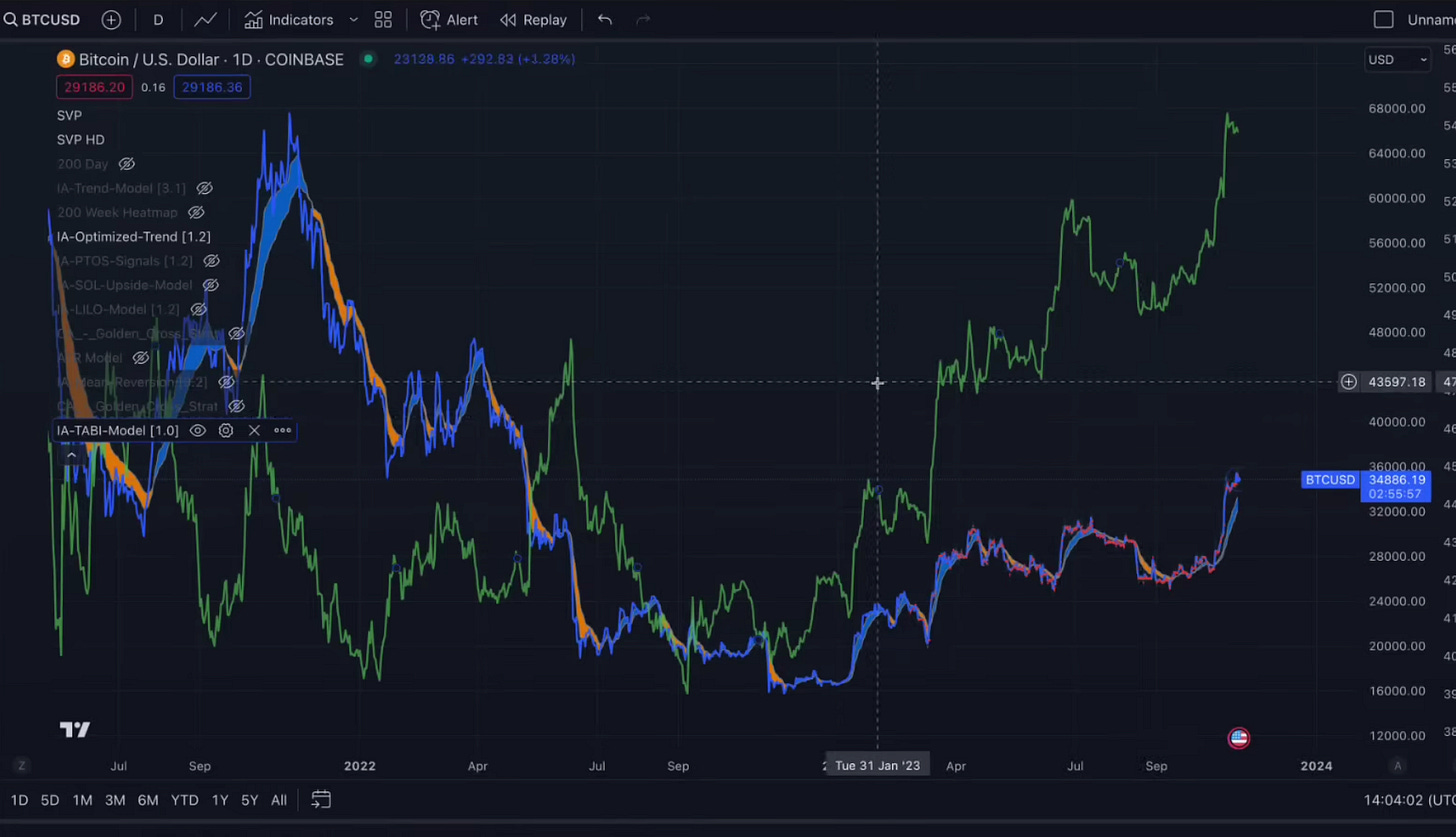
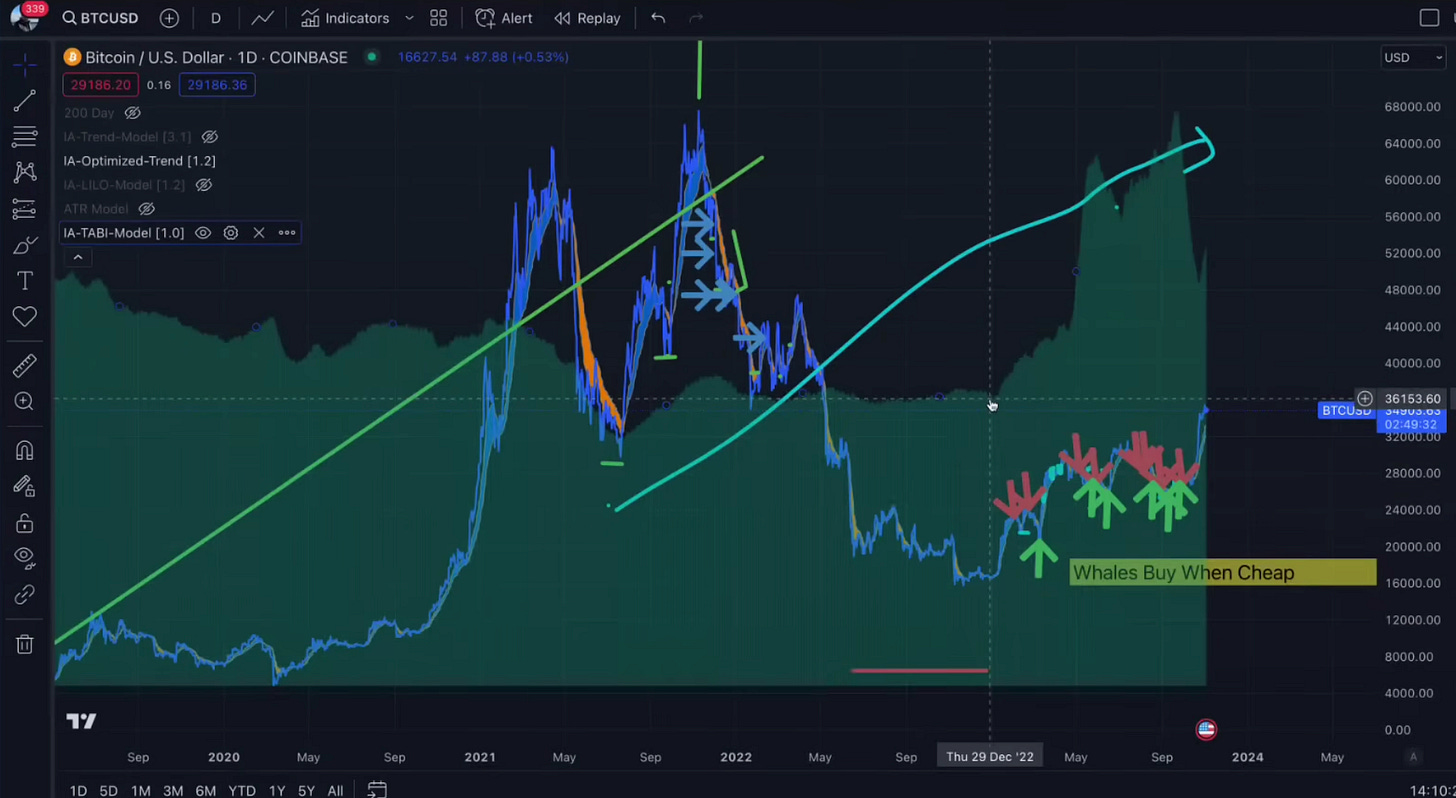
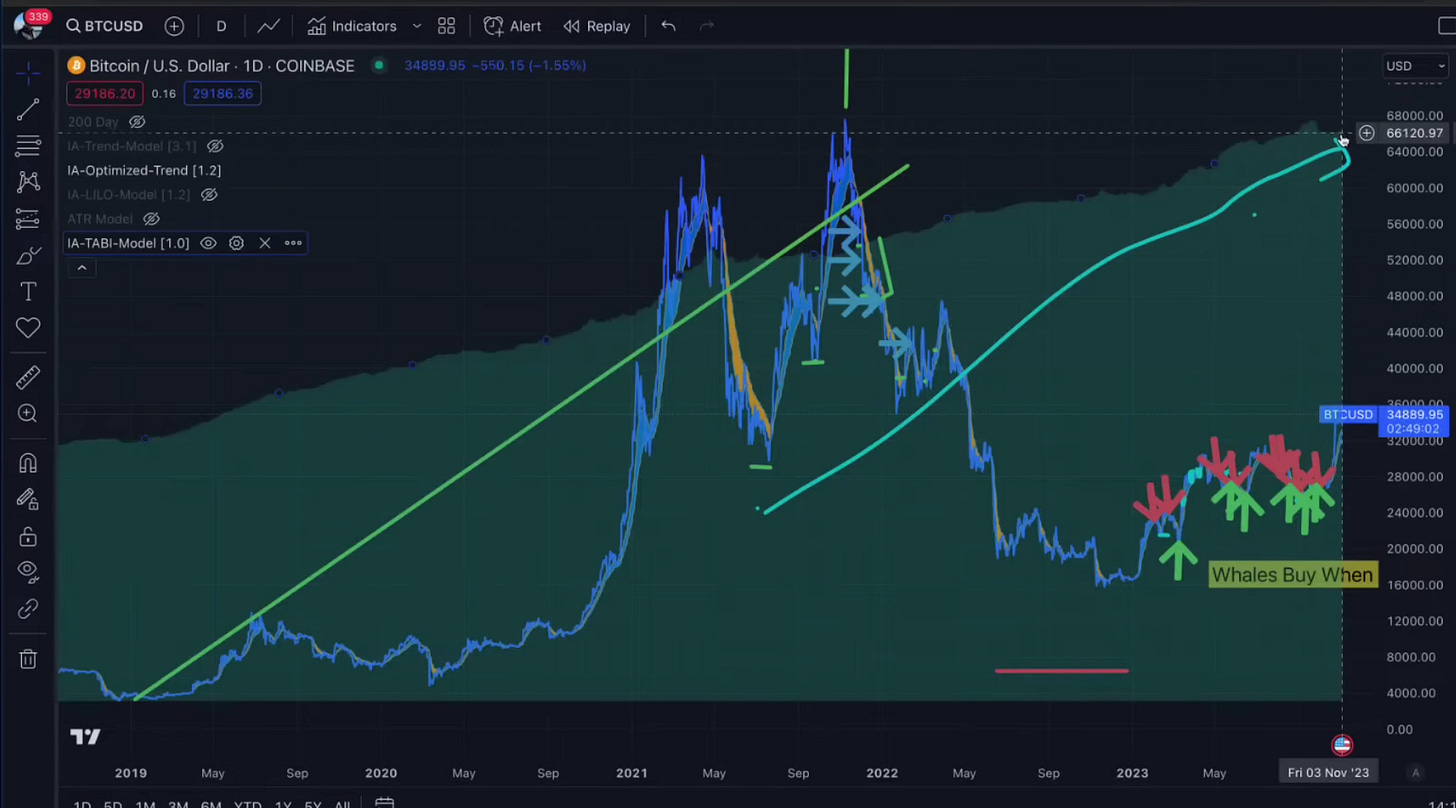
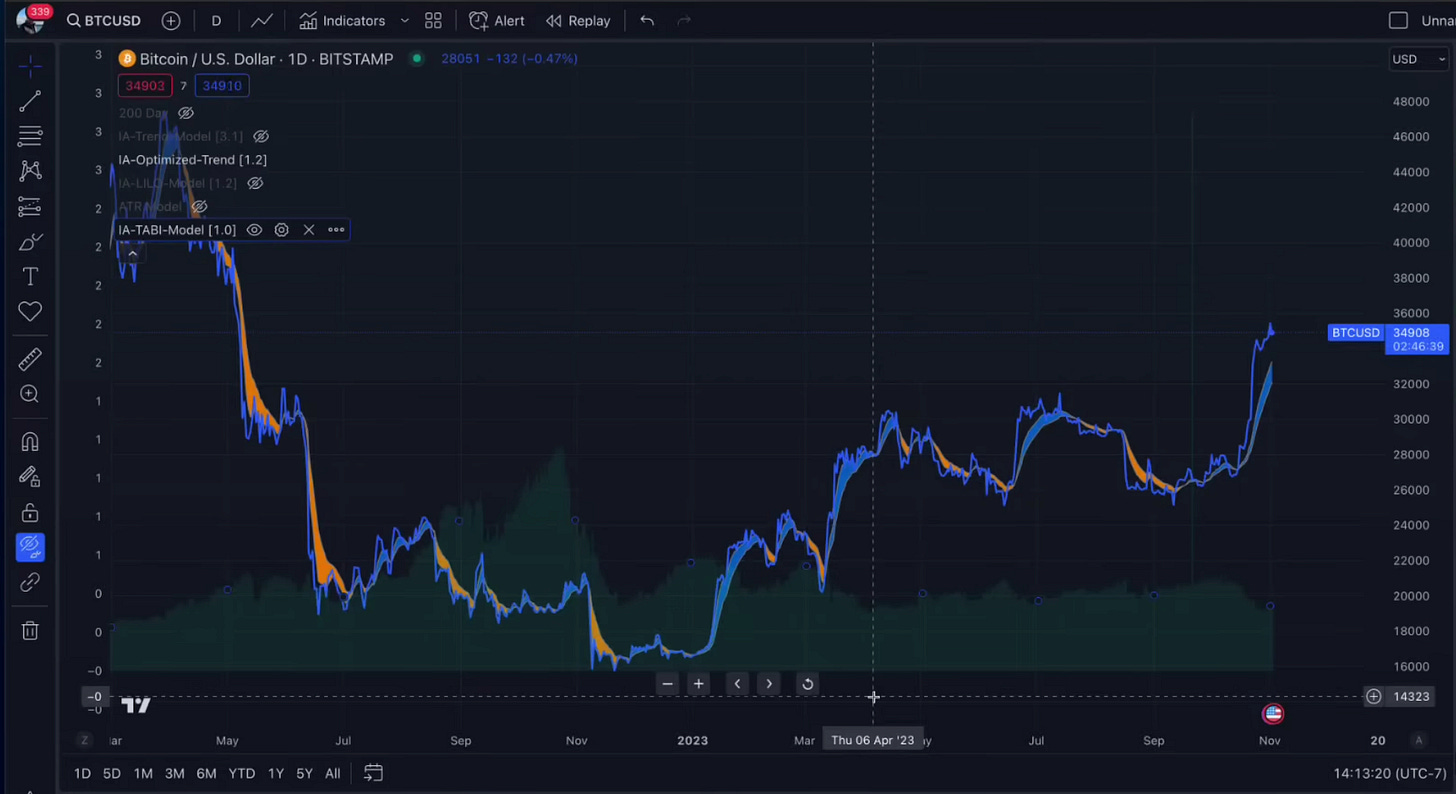
The TA that I do is very different because it uses models and math versus just drawing lines on a chart, and our approach works. Today, I will introduce you to a Bitcoin Top & Bottom Indicator (aka TABI).
It is more important to grasp why we built this than how it works. Back in 2021, I didn't catch the peak of the Bitcoin cycle, having projected a high of $89K, unaware of the behind-the-scenes manipulations. Investment, fundamentally, boils down to the investor's philosophy and mindset. Whenever I err, I am my own toughest critic.
At the time, I lacked the tools to gauge and determine when people are running for the door in the Bitcoin market. So, for the last two years, I have worked with my development team to build models that help eradicate the risk of repeating the same mistake.
To start, we will survey the ingredients that go into TABI because there is a heck of a lot more than meets the eye. TABI’s ingredients are listed on the right, and we will cover them in detail in this lesson.
This is a simple ratio that works well by dividing Bitcoin price by the 350-day moving average.
A low multiple means you are in the kill zone, and a high multiple means the danger zone.
Bitcoin dominance should be taken with a grain of salt, but it does tell you exactly how strong it is relative to other assets. Focus on excising the winners by doing the work upfront.
A low NVTS indicates that the Bitcoin network is undervalued, and a high NVTS suggests it is overvalued. The magic comes when you combine the NVTS together in search of confluence and generate an overall composite score.
The Hodlers & Hodler metrics reveal who is buying and selling, as well as who is in profit and who is not.
The hash rate indicates how secure the network is, and it is extremely important to analyze Bitcoin miners to forecast their future profitability. The theory is that the more secure the network, the more money it draws in and the more valuable it makes Bitcoin. My theory is that price follows the hash, but many believe differently.
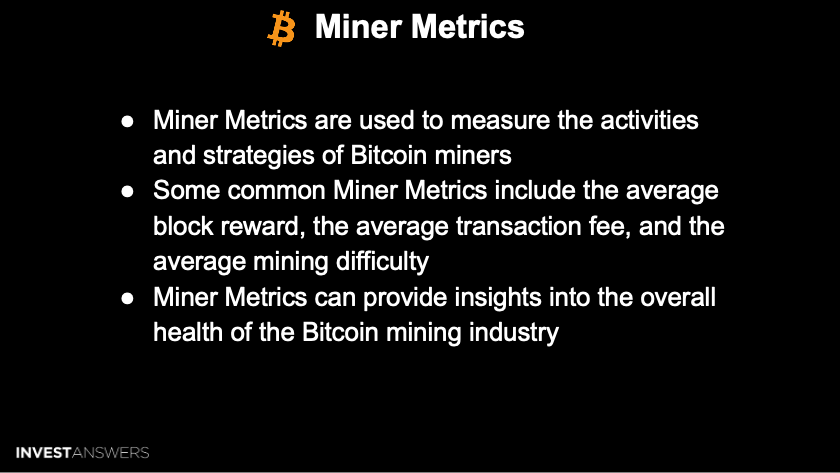
Miner Metrics are important because the majority of the supply coming into the ecosystem comes from miners. We use this to measure both the activities and the strategies of miners. If the miners are dumping a lot of Bitcoin, it can bring the price down, so it is critical to monitor.
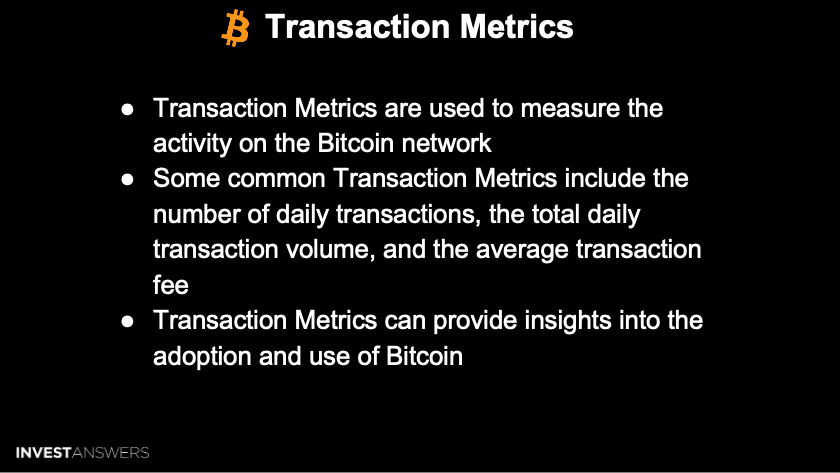
The transaction metrics show the overall health of the network. We observed a lot of weird anomalies early this year with the Ordinals' activity in early 2023, so this can sometimes become irregular. Bitcoin's network value will ultimately be driven by Metcalf's law, which is the amount of use that the network has.
Numerous user types are accounted for, as well as what they commonly do on the network. This is critical to watch.
It is essential to follow what the whales do ie Large Holder Flows - and we built that into TABI. The whales are pretty good at buying bottoms and selling tops.
We need to monitor how many people are in profit with their Bitcoin positions. Typically, a high-profit ratio makes for a more bullish environment; however, when everyone is making money, that serves as a red flag. 99% in profit means folks will start running for the door.
The perp ratio is concerned with measuring futures contracts. Whenever there is a lot of money going into future contracts for higher prices, it is a positive sign for price action. The investors who trade these instruments tend to be very sophisticated versus the average retail investor.
You must be well-rounded if you want to be successful at investing. It is critical that you look at on-chain indicators but not use them in isolation. Fundamental analysis must come first, and then you use technical analysis to determine when to get and to get out of the asset.
For example, these indicators cannot determine if a Bitcoin spot ETF is coming or is getting approved. You must keep your head out the window to see what is going on.
TABI Settings in Trading View:
Designed to work on the daily time frame because calculations for on-chain data are supplied on a daily basis
Settings (cog symbol) > Inputs > Metric gives you the option to review the various ingredients in the model
Each indicator in the suite supplies a breadcrumb as to what is going on in the market
TABI:
When in blue--the darker, the better--you buy as much Bitcoin as you can
When in green, it is a good time to buy
When in yellow, you begin layering in less
When in light orange, you start layering out to take profits
When in dark orange, get ready to pull some sell triggers
When in red, exit the Bitcoin market
Pi Cycle Ratio:
Adjust the scale of the indicator to "Percent," and when you see 50%, you are entering the danger zone, -50%, you are entering the maximum accumulation zone
Puell Multiple:
When it is low, this indicates the time to buy
When it is high, this indicates the time to sell
This is not perfect, but it is a very good indicator of the overall trend
Dominance:
This is there if you need it, but you must remember that the vast majority of crypto does not matter
Historically, when the dominance trend is high, the price follows
I do not put much weight on this ratio as things have fundamentally changed in the space
NVTS:
Adjust the scale of the indicator to "Percent"
When the score is high, it is time to get out
Sometimes MVTS can be high for different reasons, like a big spike in price
Hodlers:
The trend is up and to the right, which is one of the main reasons that I believe "this time will be different" in Bitcoin
Currently, this indicates that no one is selling
Hash Rate:
The trend is up and to the right, and the price follows hash
If the hash rate continues to go up and the price continues to lag, then the miners will be in a world of hurt
Miner Flows:
This shows you what miners are doing in terms of inflows and outflows of the supply
The miners usually have very good tabs on what is happening in the BTC market
Watch for when they start a large accumulation period, as that indicates price advance
Miner Reserves:
Measures how much stock of Bitcoin the miners are holding
This trend continues to fall over time because they know that the reward will be halved, and their rigs can become too old to remain profitable
Transactions Counts:
The ordinals came into the market in early 2023, making numerous transactions happen, and now we see that it recently began spiking again, which is a good sign for the network.
Retail:
Displays the number of retail holders in the Bitcoin network now at 48.4M
Bitcoin network is currently undervalued based on Metcalfe's law
Larger Holders:
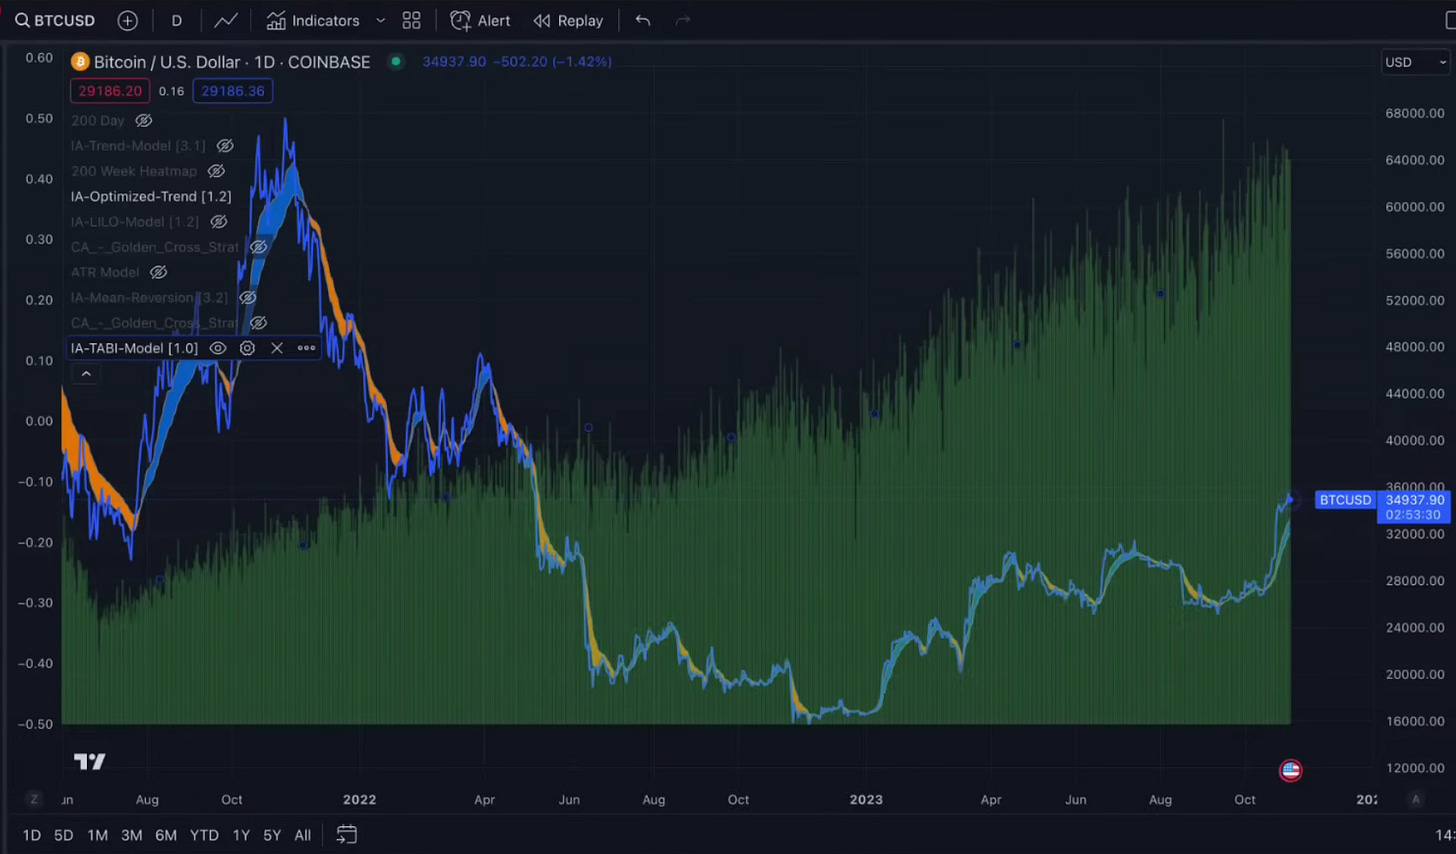
When you see the price fall, you will observe that large holders buy, accumulating similarly to the IA DCAS strategy
The more expensive that Bitcoin becomes, the less the long-term holders buy
Watch the Green Peaks and Valleys
Profit Ratio:
Holders start to take profits the closer this indicator gets to 99%
Perp Ratio:
The Perp Ratio is an indication of how much bullish sentiment is observable on the actual network
How many sections are in the IA TABI model?
Nineteen total indicators are included in the suite, with a composite score calculated in TABI.
Will you make the TABI equivalent for Solana?
I would if I had the data. The problem is how hard it is to aggregate the on-chain data.
Will there be a time when Bitcoin no longer goes down in value, and what will be the key indicator of such an event?
The most fascinating attribute of Bitcoin is its scarcity. For the first time, we are entering a halving cycle with decreasing supply and exploding demand. Once the level of allocations begins to replace Gold, it will happen.
What is your target for Bitcoin in this bull market?
This time is different because of institutional money, which is far scarcer than before. I think we will do a $100-120K BTC this time. I will be updating you every Tuesday and Thursday on what I see happening with on-chain data.
Is TABI a confluence from all the other models?
Yes, it is. A backtested finally tuned amalgamation composite score of elements of all the different models put together with proper weighting. Think of it like a risk metric tool.
What do you think the effects will be of ETFs holding large amounts of Bitcoin will be after the bull market runs its course?
Risk will be managed using options as I do it. Options will be used for leverage and to hedge. The primary driver will be BlackRock's Alladin algo platform behind the scenes, driving allocations to Bitcoin.


