


Today’s Nuggets
Surging Cost of U.S. Debt
Tumbling Global Liquidity
Fed Keeping Rates High?
Block Completes Development of BTC Mining Chip
Miners Making Bank!
Ethereum’s Bleed has Slowed
Jupiter’s Major Acquisition
Tesla Launches the New Model 3 Performance
New Largest Oil Producer?
The Crypto Market Update:
The global crypto market cap is $2.5 trillion, with a 24-hour volume of $70 billion.
The price of Bitcoin is hovering around $66,600.
The Crypto Fear & Greed Index is currently Greed (71) - higher than last week.

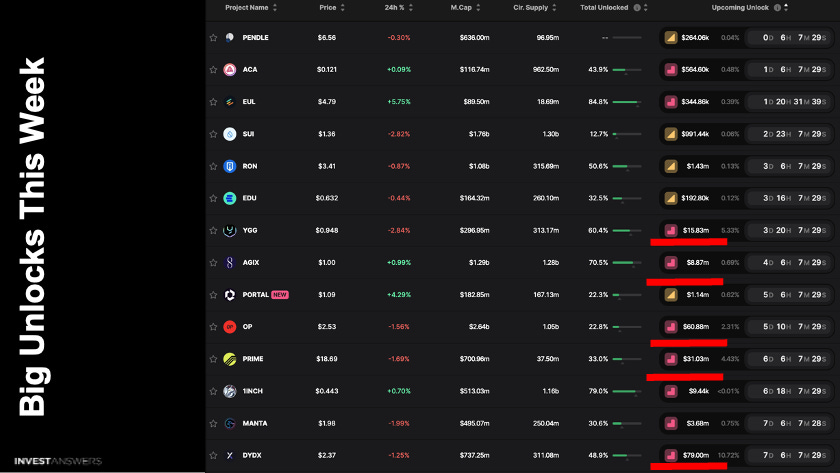
Here is a list of the noteworthy unlocks this week - some nasty ones:
YGG = 5.33%, this is a money grab…
AGIX = $8.67M
OP = 2.31%, non-stop raining!
PRIME = 4.43%
DYDX = 10.72%, has been leaking coins for a long time
This is why we built the compendium! - to identify these things.
The selling is just too much for any price appreciation over time.

In February, the tab for servicing debt for the U.S. government was $1.1T - bonkers!
Can you imagine all of the good you could do with that money?
You print money to pay for stupid programs that do not do anything and then you pay money on the debt that you print…
Some things I just do not understand!

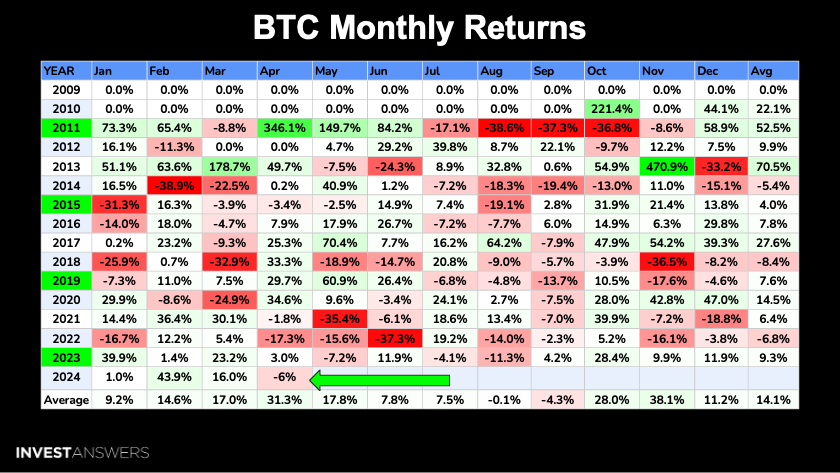
Bitcoin is still down 6% for April.
I believe it will turn positive but perhaps it will take a breather after being up for seven consecutive months - the longest period since 2012!
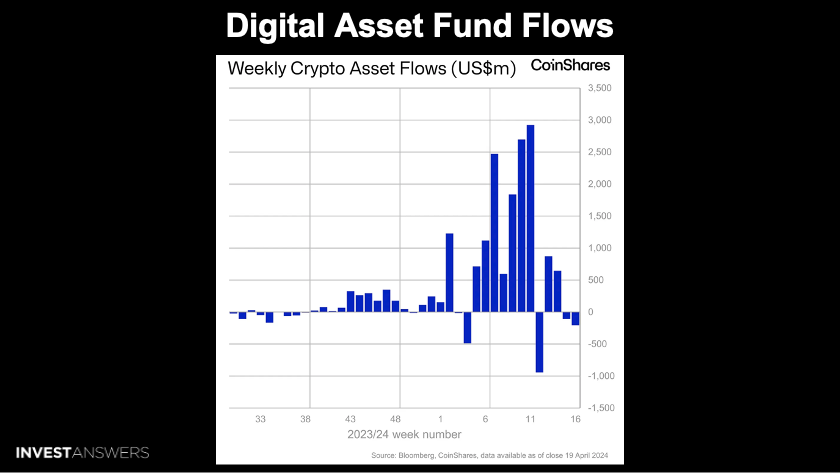
Digital asset investment products saw outflows for the second consecutive week, totalling $206M, with trading volumes in ETPs dipping slightly at $18B.
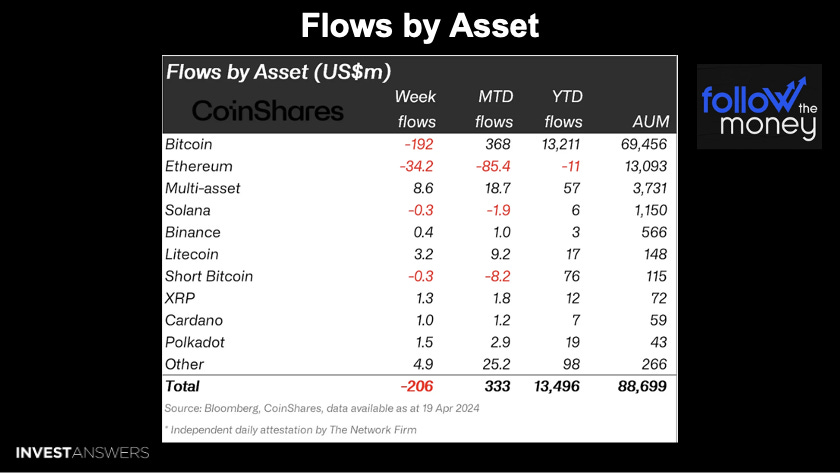
Bitcoin saw $192M in outflows;
Ethereum saw $34M outflows, marking its sixth consecutive week;
Solana lost $300K, which is nothing;
Litecoin was up $3.2M;
Chainlink increased by $1.7M;
XRP was up $1.3M; and
Polkadot gained $1.5M.
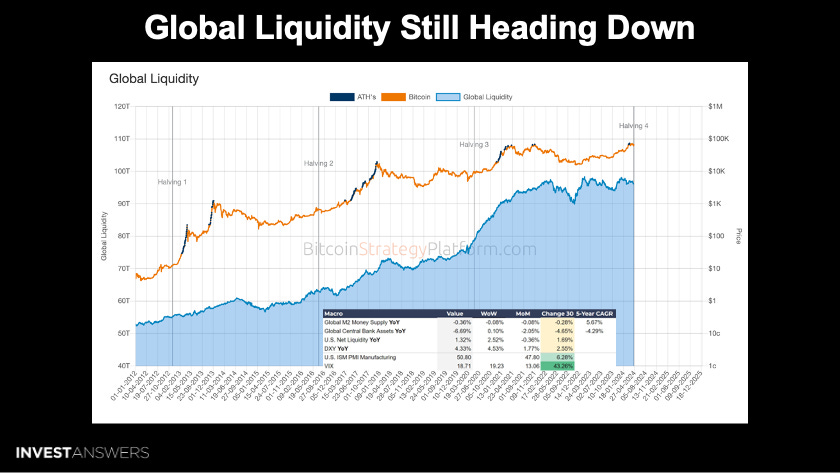
I was hoping for $100T of global liquidity in 2024, but it has been in a downtrend.
The chart details at the bottom indicate that there has been a tiny bright spot, as you will see that the U.S. net liquidity year-over-year is now up 1.32% and week-over-week 2.52%.
As always, we will continue to monitor this closely…

Historically, the Fed takes an average of 8 months from the last rate hike to start cutting rates.
With the last rate hike in July, we are already ten months out with no cuts, making it the fourth-longest streak since 1968.
There is a lot of talk about the cut being in July.

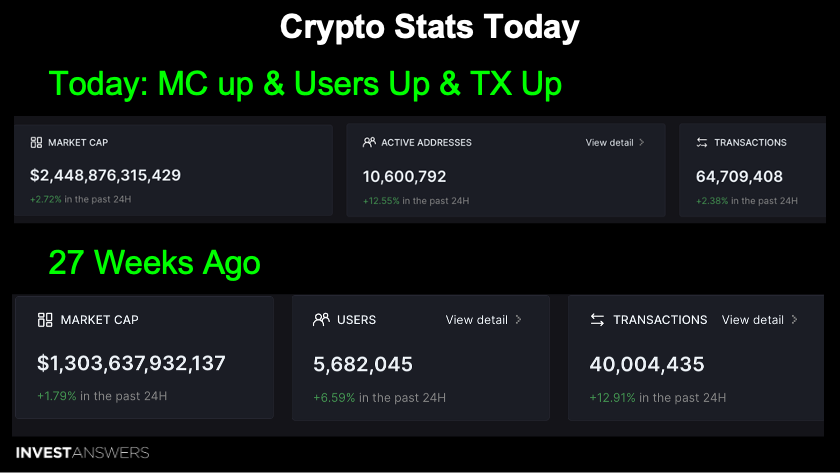
Since I started measuring this 27 weeks ago, the crypto stats are:
$2.5T market cap versus $1.3T;
5.6M users have grown to 10.6M; and
40M transactions have increased to 65M.
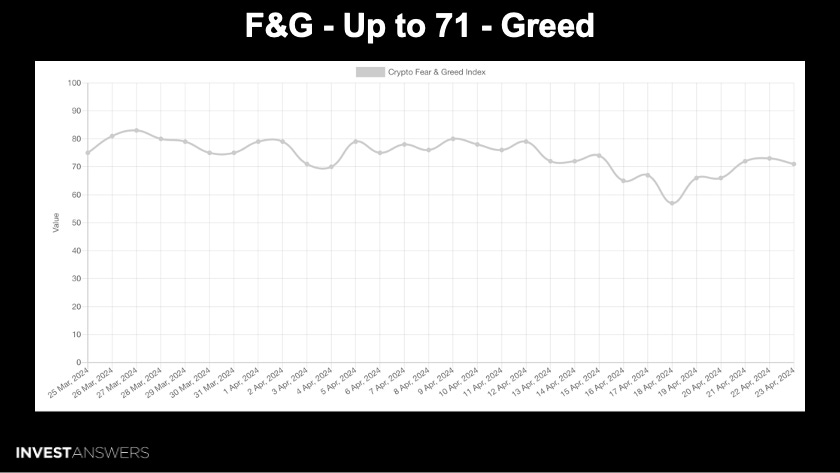
The Fear & Greed is at 71 continuing to hover in the greedy zone.
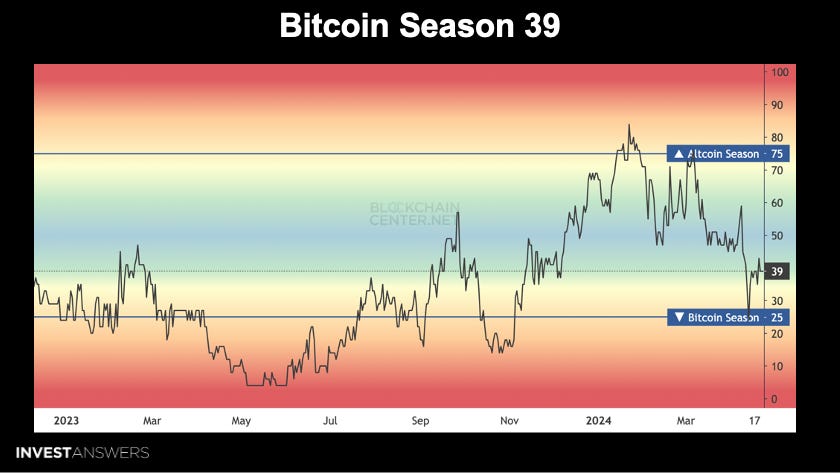
The Altcoin Season Index was at 39 a week ago and has not changed week over week.
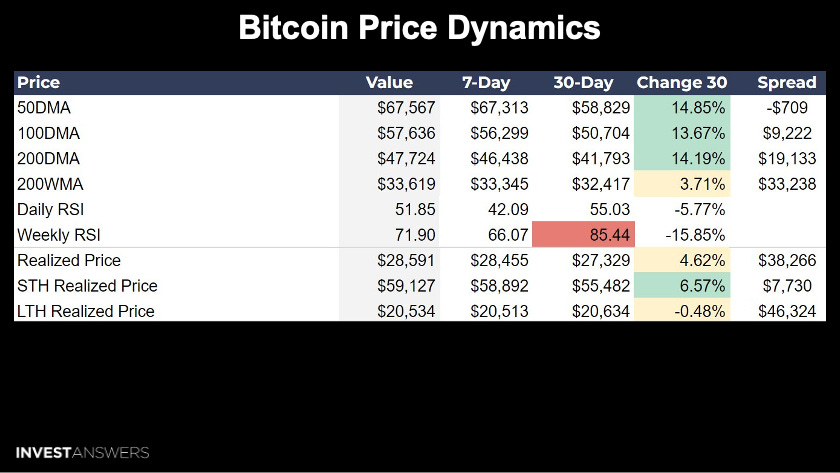
The supply dips from 96.11% to 92.44% in 30 days, hinting at maybe a bit of a consolidation phase.
The change 30 column indicates the daily RSI is down 5.77% and the weekly is down 15.85%.
There are mixed signals between the neutral daily RSI, a cooling weekly RSI, and bullish Realized Price metrics.
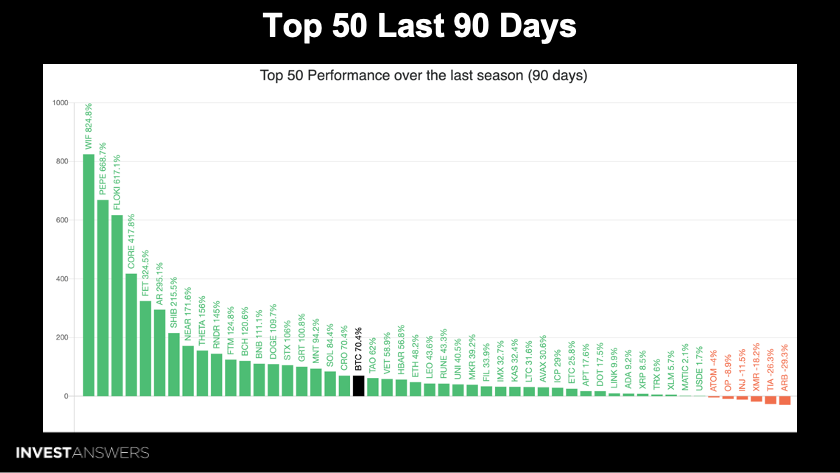
Bitcoin is up 70.4%, left of center in black but people are not happy because
Keep reading with a 7-day free trial
Subscribe to InvestAnswers Newsletter to keep reading this post and get 7 days of free access to the full post archives.