


NUGGETS OF ALPHA
A Golden Cross occurs when the 50-day SMA surpasses the 200-day SMA
Due to the rampage from $29-35K in two days, the 50-day moving average is currently above the 200-day moving average
My Bitcoin multiplier is 21x or 1/2 of a percent of the assets coming into Bitcoin
The average duration of a BTC Golden Cross is 422.5 days
The Golden & Death Cross has served as reliable signals for profitable trades in Bitcoin over its lifecycle

This lesson will center on a technical analysis indicator I discussed a few years back when I started the InvestAnswers Community. Today, we will delve into a deeper analysis using the Golden Cross as a signal of the incoming Bitcoin Golden Cross.
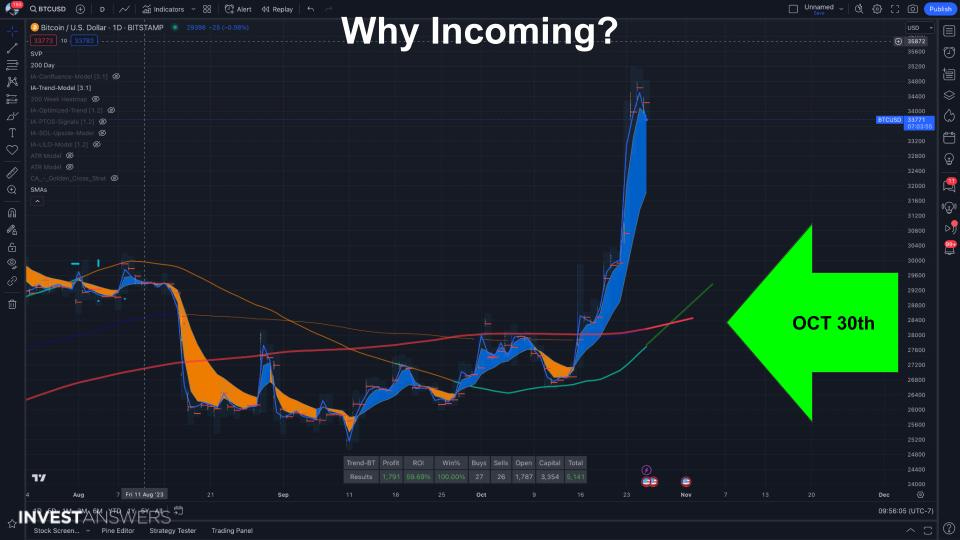
Bitcoin has seen a 30% price surge in the past two weeks, nearing a "Golden Cross" pattern, indicating a possible bullish trend. I will back-test some of this information to show where we are coming from.
A Golden Cross occurs when the 50-day simple moving average (SMA) surpasses the 200-day SMA, suggesting that short-term price momentum is outpacing the long-term.
The current data from TradingView shows
Keep reading with a 7-day free trial
Subscribe to InvestAnswers Newsletter to keep reading this post and get 7 days of free access to the full post archives.