


TODAY’s TAKE
February 7th, a BTC Golden Cross occurred
A Golden Cross is definitely a bullish sign in Bitcoin’s history
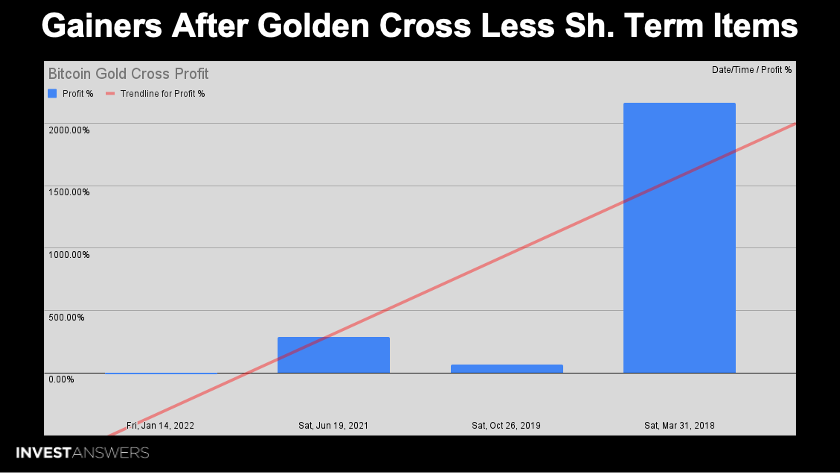
Bitcoin’s gains are clearly in a trend of diminishing returns from this study
448.38% would be the average gain if you traded from Gold Cross to Death Cross between 2014 - Today
If you remove short-term anomalies, the returns move from 448.28% to 628.64%
TA can sometimes be a self-fulfilling prophecy as people buy into the narrative

Our IA TradingView chart indicated the Golden Cross was incoming, and it hit on February 7th. All major Bitcoin rallies in history have started with a golden cross:
February 2012
October 2015
May 2020
TradingView reveals that these three occurrences presaged at least a yearlong bull market that saw prices rally between 100% to 600%.
On the other hand, the golden crosses of July 2014, July 2015, and February 2020 were bull traps as the cryptocurrency crashed violently into a death cross.

Such articles coming out today are simply fluff. This channel is all about numbers and not fluff!
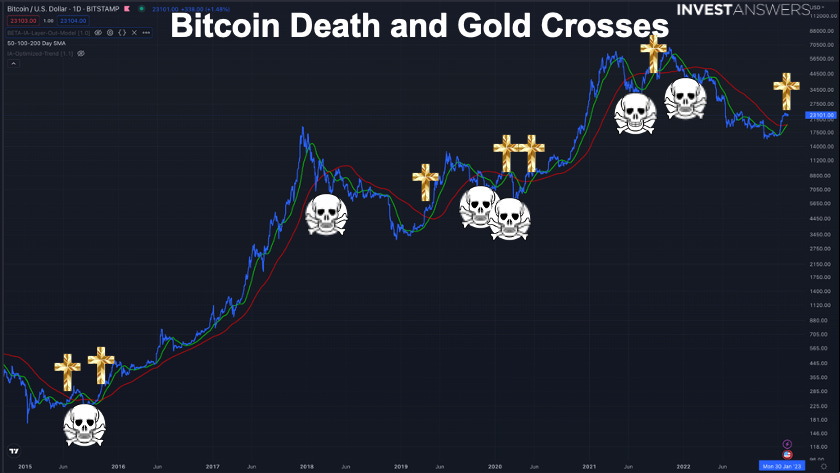
🟥 - 200-day moving average
🟩 - 50-day moving average
This is a daily log chart of Bitcoin’s historical death and gold crosses since 2014:
6 Death Crosses
7 Golden Crosses
It is important to observe that in some circumstances, there are pair occurrences of death crosses and golden crosses over BTC’s history.
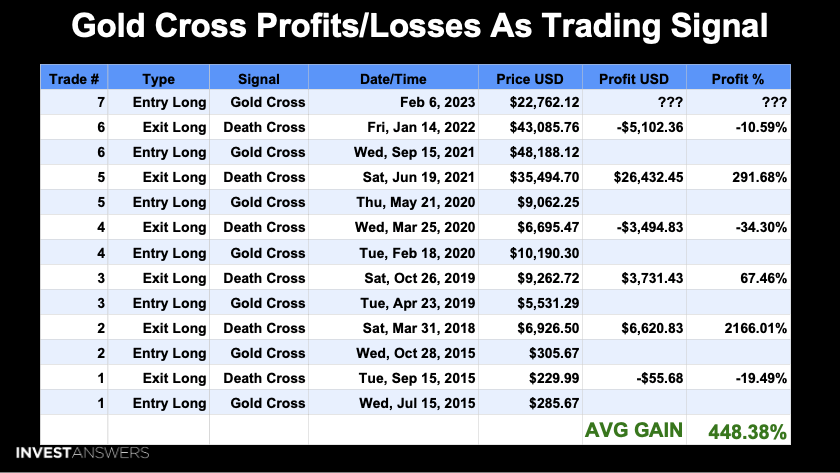
Here is the data pulled from the log chart we just observed.
These profit numbers assume the account selling at the Death Cross, but that is typically after a long downward spiral. The returns would be much higher if one took profits at the top.
*February 18th to March 25th, 2020, was a bit of an anomaly due to COVID-19.
So the current question is will BTC take another dip to form a double Death Cross (occurred twice since 2014), or will it rally higher?
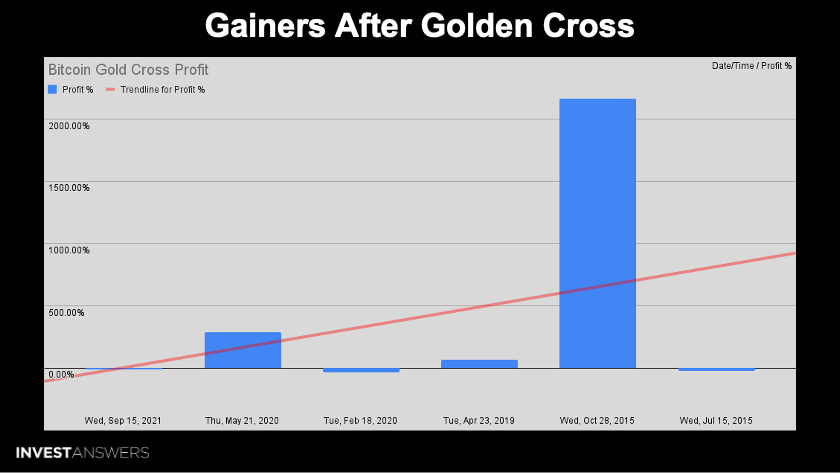
In three occurrences, Bitcoin experienced minuscule returns. And in three situations, Bitcoin experienced massive gains. However, you will also notice that over time, a trend of diminishing returns is observable.

In this chart, I illustrate the number of days between the Death Cross and the Gold Cross for all of these various trades:
2015 = 62 days (the market was not mature anomaly)
2018 = 885 days
2019 = 168 days
2020 = 36 days (COVID-19 anomaly)
2021 = 394 days
2022 = 121 days
448.38% would be the average gain if you traded from Gold Cross to Death Cross during the 8-year period.
What if you pull out the anomalies?
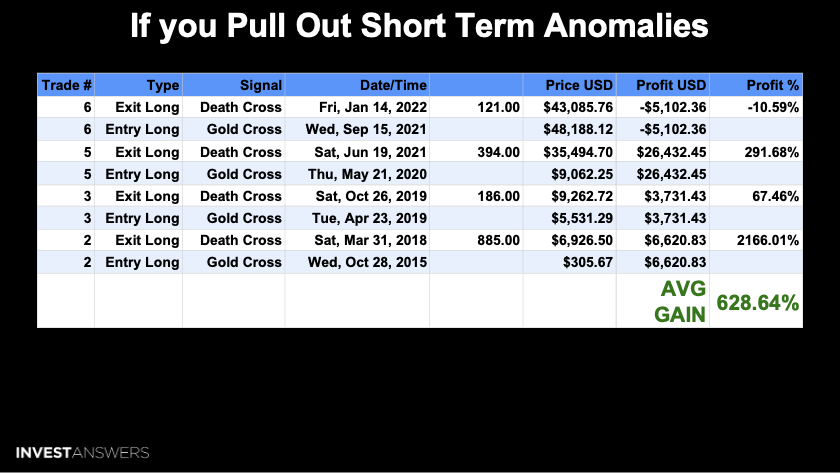
The gains move from 448.28% to 628.64% over the four trades.
So where are we now? I do not know, but indicators are looking bullish.
A Golden Cross is definitely a bullish sign in Bitcoin’s history.
Technical analysis can sometimes be a self-fulfilling prophecy as people buy into the narrative and begin trading based on it.

Last week SPX experienced a Gold Cross, and now the commodity GOLD has triggered a Golden Cross. I wonder if GOLD can hit an all-time high after languishing for the last 11 years? If you factor in the U.S. dollar purchasing power loss over this period, it is down over 40%.
So what is in your wallet?