


TODAY’S TAKE
Dollar-cost averaging is investing a fixed amount at regular intervals, regardless of market conditions
DCA removes risk and volatility in a portfolio over time & works best for volatile assets if you have a system
Timing of the markets’ tops and bottoms is challenging to achieve
IA DCAS model indicates when projects are overbought versus oversold
IA DCAS helps weight your allocation around the best entry points in an asset
All assets mean revert, avoid buying after a significant daily gain
DCAS has been tested and reliably demonstrated to work in all types of markets
Monday is the day to DCA into the market if you are based in the U.S.
DCAS works in all market conditions and across all types of assets
IA DCAS model outperformed DCA in all incidents tested and keeps your spending down for non-performing assets

So the key question of this lesson is whether you can beat dollar-cost averaging (DCA) regardless of market conditions?

Dollar-cost averaging (DCA) is a well-known investment strategy that involves investing a fixed amount of money at regular intervals, regardless of the market conditions. Many people believe it cannot be beaten.
Let’s explore if an investor can optimize putting in regular investments within a systematic set of intervals across all market conditions.
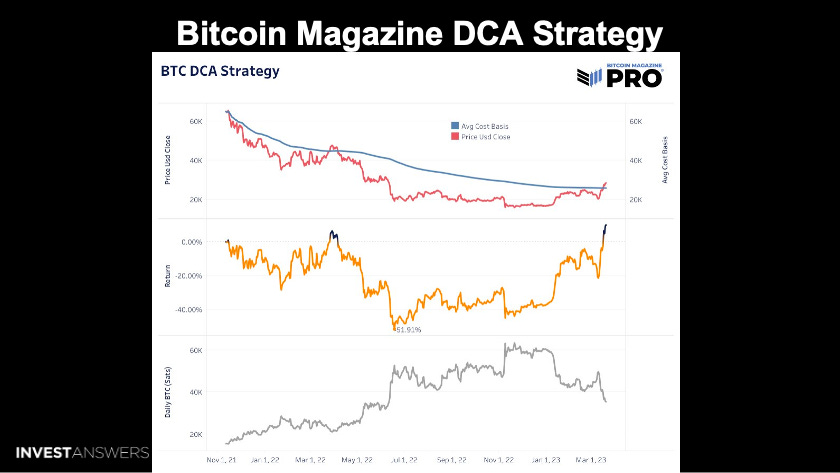
🟦 - Average Cost Basis
🟥 - Price USD Daily Close
The BTC market topped on November 12, 2021. This graphic illustrates a DCA strategy of US$100 over time. The key to this study is to identify principles we can practically apply to our investment strategy.

Whether DCA can beat lump sum investing is a highly debated topic in investing. While there is no definitive answer, DCA removes risk and volatility. Lump sum investing works well if you can nail bottoms.

🟩 = DCA wins (5)
🟦 = Lump Sum wins (7)
Timing is everything. DCA brings about exponential results during crashes, but early cycle lump sum investments can perform better in certain instances. The simple option is to adopt DCA and automate your investment decision-making process.
DCA works best for volatile assets if you have a system.

You must be on the train to capture the big gains.

This IA DCAS model is a layer-in buying model that indicates when projects are overbought versus oversold. Green lines below the line (0.00) you buy. The deeper the candle, the more advantageous it is to buy.

We will now review the model using different entry point periods such as daily, weekly, bi-weekly, and monthly.

BTC Neutral Daily DCA vs. DCAS (Nov 11, 2021 - March 22, 2023)
Shares: 1.929 vs. 3.274
Spend: 49500 vs. 72241
ROI: 11.0% vs. 29.1%
Daily DCAS supplies both higher performance over the weekly strategy and deploys a larger sum of capital.

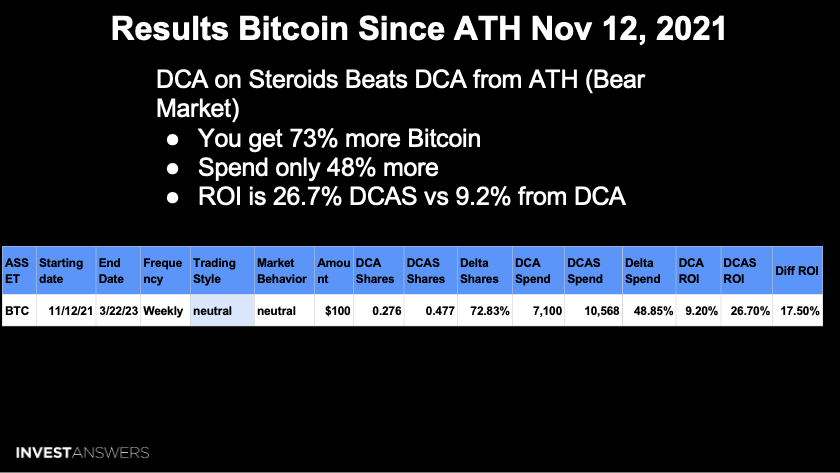
BTC Neutral Weekly DCA vs. DCAS (Nov 11, 2021 - March 22, 2023)
Shares: 0.276 vs. 0.4770
Spend: 7100 vs. 10588
ROI: 9.2% vs. 26.7%

BTC Neutral Bi-Weekly DCA vs. DCAS (Nov 11, 2021 - March 22, 2023)
Shares: 0.127 vs. 0.199
Spend: 3300 vs. 4517
ROI: 8.8% vs. 24.8%
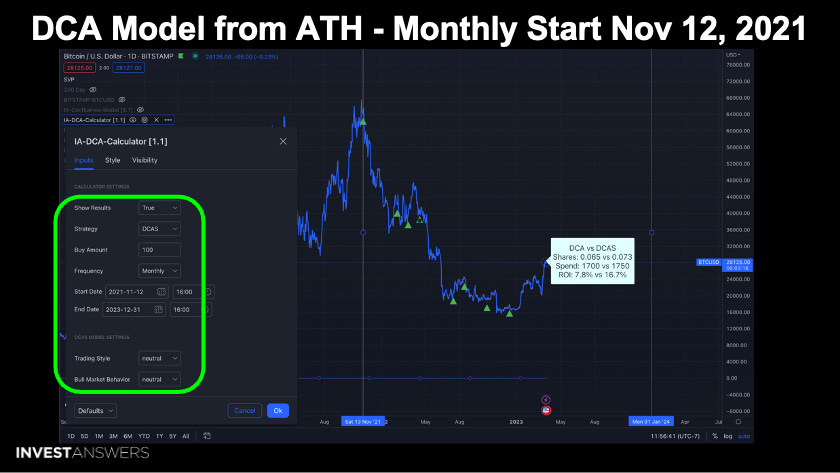
BTC Neutral Monthly DCA vs. DCAS (Nov 11, 2021 - March 22, 2023)
Shares: 0.065 vs. 0.073
Spend: 1700 vs. 1750
ROI: 7.8% vs. 16.7%
Monthly creates a significantly less number of green arrows and generates fewer purchasing signals. However, when the IA DCAS does create a buy trigger, it’s for large allocations. Notice that the weekly versus the monthly DCA strategy results in a similar range of ROI, but there is a significant difference in the DCAS model.

BTC Conservative Daily DCA vs. DCAS (Nov 11, 2021 - March 22, 2023)
Shares: 1.929 vs. 2.025
Spend: 49500 vs. 43911
ROI: 9.4% vs. 29.4%
When IA DCAS is set into the conservative mode, it triggers buy signals with less risk. This resulted in better performance than the previously reviewed Neutral model over this period.

BTC Conservative Weekly DCA vs. DCAS (Nov 11, 2021 - March 22, 2023)
Shares: 0.276 vs. 0.256
Spend: 7100 vs. 5481
ROI: 9.2% vs. 31.1%
The conservative model over this period produced less Bitcoin, less spending, and higher ROI!

BTC Conservative Bi-Weekly DCA vs. DCAS (Nov 11, 2021 - March 22, 2023)
Shares: 0.127 vs. 0.129
Spend: 3300 vs. 2718
ROI: 7.7% vs. 33.5%
Conservative mode resulted in spending less and performing better with these past market conditions. However, the opposite would be true if you are in a strong bull run.

BTC Conservative Monthly DCA vs. DCAS (Nov 11, 2021 - March 22, 2023)
Shares: 0.065 vs. 0.050
Spend: 1700 vs. 1052
ROI: 7.3% vs. 34.2%
The results continue in line with the previous periods reviewed.

Gold Neutral Weekly DCA vs. DCAS (July 2, 2011 - March 22, 2023)
Shares: 42.706 vs. 45.421
Spend: 61200 vs. 60898
ROI: 37.0% vs. 46.4%
Notice how switching to a different asset with less volatility demonstrates how IA DCAS is less impactful in generating value versus DCA.
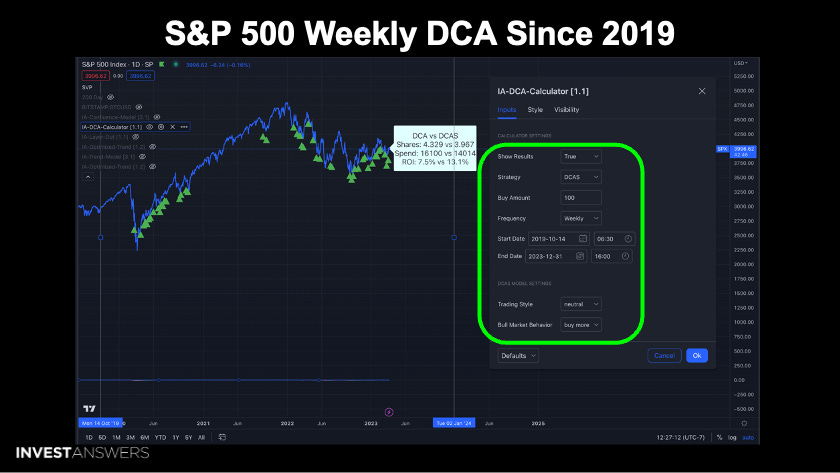
S&P 500 Neutral Weekly DCA vs. DCAS (October 14, 2019 - March 22, 2023)
Shares: 4.329 vs. 3.967
Spend: 16100 vs. 14014
ROI: 7.5% vs. 13.1%
IA DCAS works with traditional equity indexes as well.

Google Conservative Weekly DCA vs. DCAS (December 14, 2018 - March 22, 2023)
Shares: 99.433 vs. 78.169
Spend: 8300 vs. 5003
ROI: 27.0% vs. 65.7%
Google supplies a helpful case study for IA DCAS under conservative settings. During the pre-bull run, frequent buying signals are triggered. Then after the bull run, the model does not signal to buy throughout the move-up.
My portfolio was overweighted in Google during this period, so I kept the model in the conservative mode for this backtest. If your portfolio becomes overweighted in an asset, you can move the model into the conservative mode to decrease your spending. At the same time, you gain exposure to other assets to diversify your portfolio.

Solana Aggressive Weekly DCA vs. DCAS (January 28, 2022 - March 22, 2023)
Shares: 203.272 vs. 178.566
Spend: 6000 vs. 3722
ROI: -28.0% vs. 1.9%
The IA DCAS needs two years’ worth of data to run effectively. Therefore, for assets younger than two years, the model is inappropriate for producing accurate buy signals.
DCA did not work over this period, with a negative 28% impact on one’s portfolio. However, with IA DCAS, the portfolio would have yielded just above break-even.

Solana Aggressive Daily DCA vs. DCAS (January 28, 2022 - March 22, 2023)
Shares: 1421.861 vs. 1261.593
Spend: 41800 vs. 26384
ROI: -27.9% vs. 1.4%
So again, IA DCAS performance would preserve a capital investment in Solana over this bear market period.

This is a key distinction and why one should consider DCA and IA DCAS. I always recommend having cash in hand to grab significant positions during a pullback or black swan event.

All assets mean revert, so avoid buying after a significant daily gain.
If you are doing a weekly DCA, pick Monday as your incremental entry period based on U.S. times.

IA DCAS has been tested and reliably demonstrated to work in all types of markets.

The key to any investment strategy is how much you get and at what price. Remember when your dollar cost averaging your spending is staggered across time.
All of the settings in IA DCAS were neutral in this scenario.

One of the most impressive qualities of the IA DCAS strategy is that it works in all market conditions and across types of assets.

On the X-Axis (the horizontal) is the asset tested by IA DCAS.
On the Y-Axis (the vertical) is the percentage gained or lost.
IA DCAS outperformed DCA in all incidents tested. And with the more volatile assets, it crushes DCA. So if you can nail your settings for the market conditions like in the middle of this chart, you can 5x your performance over relatively short periods.

In all assets, you also get more shares/tokens while spending less.

One significant benefit to the IA DCAS strategy is that it keeps the investor’s spend from allocating to non-performing assets. So for low-growth assets, the model keeps you from layering in aggressively.

To justify utilizing IA DCAS, you need to deploy at least $1,113 into the market to offset the model license fees.
For more info on IA DCAS click here.