Today’s Nuggets
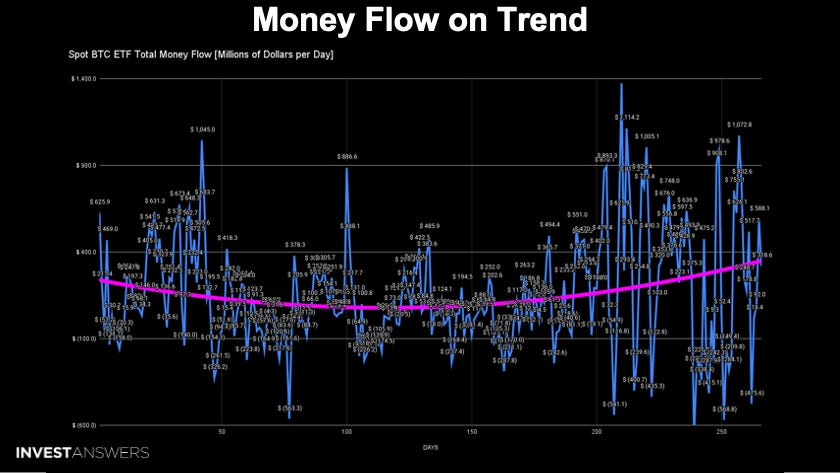
BTC Money Flow on Trend
Bitcoin Seasonality & PlanB Dreams
Bitcoin Leads the Charge
The Game Theory Horse Race
US M2 Ripping Higher
Tariffs & Bitcoin
Primed for AltSeason
SOL Futures Going Live Feb 10th
ChatGPT Struggling, Anthropic Doubling
AI Play: 90% TSLA vs 10% NVDA
Half the Data Centers on Earth
Delaware Dying
Today, we will dig into tariffs and what they mean for markets.
We will look in-depth at Bitcoin seasonality because it means a lot in this space and provides a perfect pattern for what could happen in February 2025.
IBIT's purchase had another powerful day with north of $300 million.
BlackRock is represented by the red line here and they are the ones buying up all the Bitcoin. BlackRock is a machine there is no ifs, ands, or buts.
GBTC has pretty much stopped bleeding with a couple of exceptions.
When we look at the money flow, it is bang on trend with the pink power law curve.
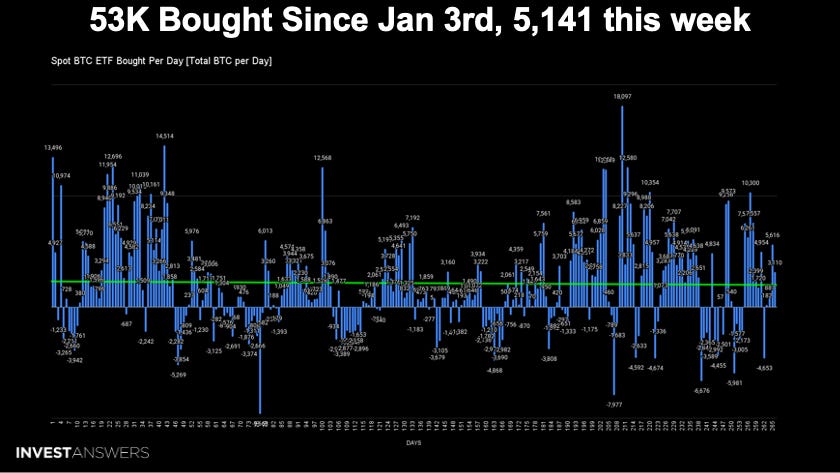
The smiley face is tilting up because now we are in this crazy accumulation zone, even though the number of Bitcoin purchases since day 210 is not as high as in the past. This is because the price is north of $100,000 of Bitcoin but the money flowing in is higher than ever, which is extremely good to see.
I was afraid maybe this thing would peter out in 2025, but that is not the case by any stretch.
53,000 Bitcoin were purchased since January 3rd and over 5,141 this week, which is crazy.
The dollar does not go as far as it used to, which is very important.
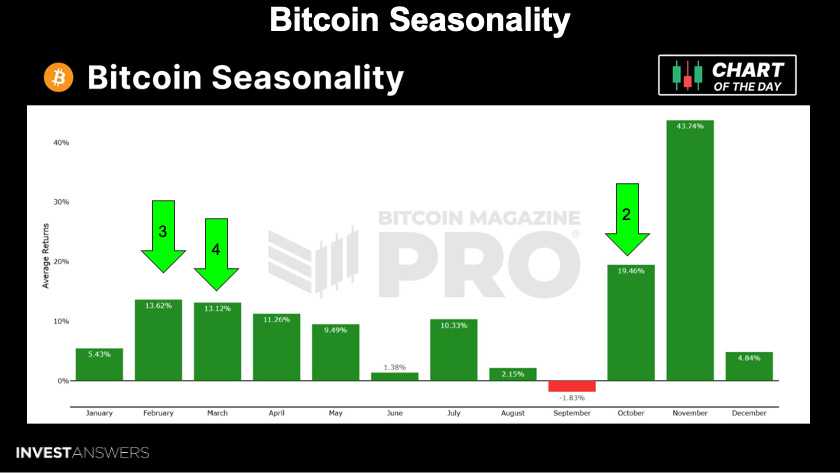
I believe in seasons and there is always a pattern. Historically, the best month for Bitcoin has always been November, and 2024 was no exception.
The second-best month for Bitcoin is October, with an average return of about 19.46%. The third-best month is what we are in now, with a 13.62% average return. Double digits, 13.62% average return, and then you can see the summer doldrums kick in.
PlanB has dreams supported by data and I respect him very much.
His dream scenario of a monthly close towards the stock-to-flow target of around 500,000 did not happen. He nailed his October and November 2024 targets and is forecasting a price of $150,000 for BTC in February.
I do not think this is likely, so I will look at some numbers from my seasonality table...
This is my monthly return chart. So far, January was up 8.61%, higher than the average January.
I have highlighted the year we are in now in green on the left, alongside the corresponding years from previous bull runs. We are currently in
Keep reading with a 7-day free trial
Subscribe to InvestAnswers Newsletter to keep reading this post and get 7 days of free access to the full post archives.


