


NUGGETS OF ALPHA
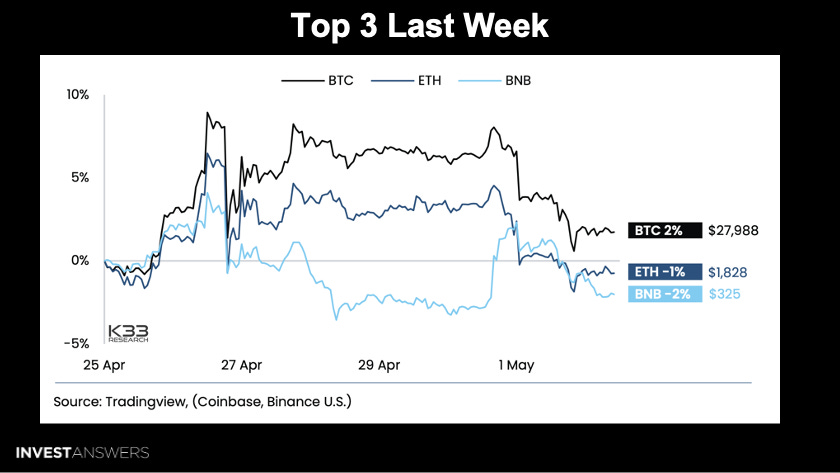
Bitcoin up 4.3% with relative strength to the crypto market continuing
Bitcoin remains in bullish trend
BTC up 21% and QQQ up 7.87% over last 90 days
MicroStrategy stock rises after big earnings beat thanks to Bitcoin’s rally
Tesla’s price action continues to run contrary to overall market’s performance
Big Tech Capex is constrained as they gain capacity for more AI tools
Fed Funds Futures Terminal priced at 5% with no more future hikes priced in
Falling earnings growth in the S&P 500 may weigh heavily on US equities moving forward
Copper/Gold ratio flashing a divergence warning sign for the stock market
United States could default on its debt as early as June 1, 2023
JOLTS report for March showed vacancies at US employers fell by more than expected
IBM to pause hiring for jobs that AI could do; ~7,800 jobs could be replaced
ISM’s Supplier Delivery Index correlates with the DOTCOM and GFC periods
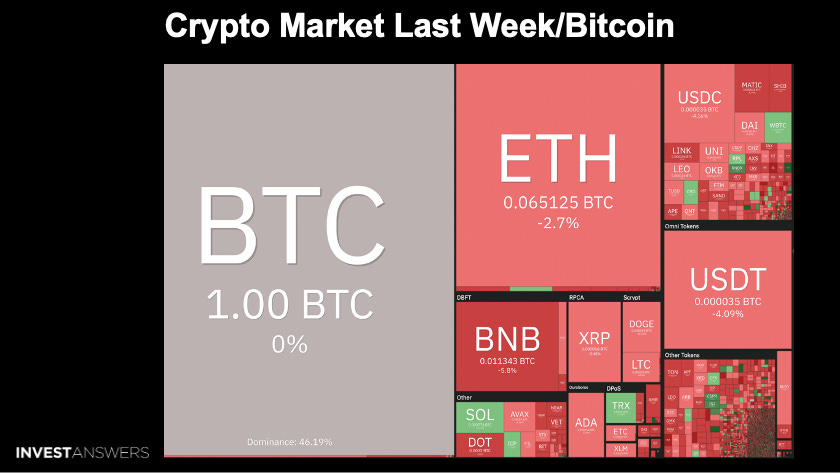
Since fiat is going to zero, we begin each week in OCTA (On-Chain Technical Analysis) by denominating everything in Bitcoin. The major projects that beat BTC last week were:
SOL
TRX
MATIC
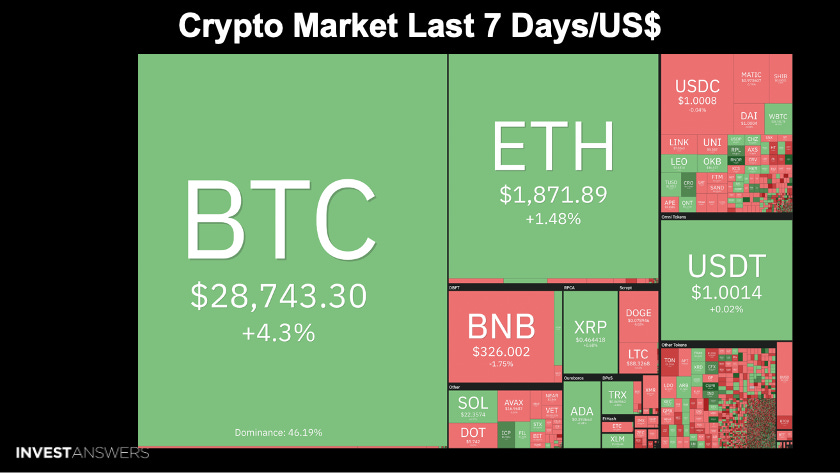
Bitcoin was up 4.3% on the week.

I am sharing this because many people are still so bearish and this chart should help you see where Bitcoin has come from and where it is going.
🟥 - 200 DMA is represented by the red line
🟦 - Period of time BTC price ranges above the 200 DMA
🟧 - Period of time BTC price ranges below the 200 DMA
Bitcoin has spent about 63% of its time above its 200-day moving average since 2010. This suggests that the long-term trend for Bitcoin is bullish, as it has spent more time above its 200-day moving average than below it. It is currently 23% above the 200 DMA, which suggests the long-term trend for BTC is bullish.

The 0.786 Fibonacci level helps confirm that we have confidence that BTC’s price low is in. In technical analysis of financial markets, the 0.786 Fibonacci retracement level is considered significant because it is one of the common retracement levels that is derived from the Fibonacci sequence. In addition, the 0.786 level is the inverse of the golden ratio (1.618), another widely used Fibonacci retracement level.
Let’s examine the BTC cycle low of 2014 to 2018 cycle low:
~$213 was the 2014 bear cycle low
~$3,157 was the 2018 bear cycle low
~$15,567 was the 2022 bear cycle low
Either humans trade around the 0.786 Fibonacci or it is a natural phenomenon.
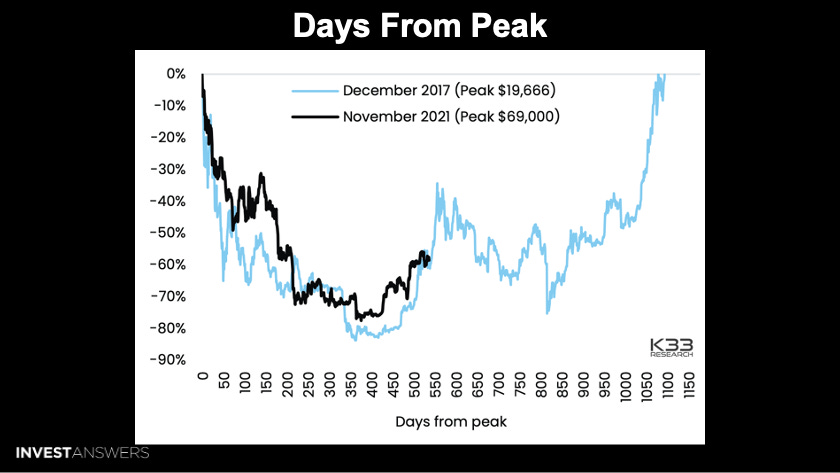
The 2019 fractal is still fascinating and the 2023 recovery is still following it closely. Both patterns follow a brutal bear market that ended in mass capitulation on soaring volumes.
In 2022, many traders focused on an $11K bottom, whereas the 2018 bear market saw traders positioning for $1,000. Neither was right. And to add to that, the consensus behind these calls left many traders underexposed.
The 2019 fractal is a reminder that the market is unpredictable. As an investor, being flexible and prepared for anything is important. So have a system, adopt a process, and do not assume anything is going to happen because you hear about it on Twitter.
Where do we go from here? I do not know, but interestingly, BTC remains so strong.
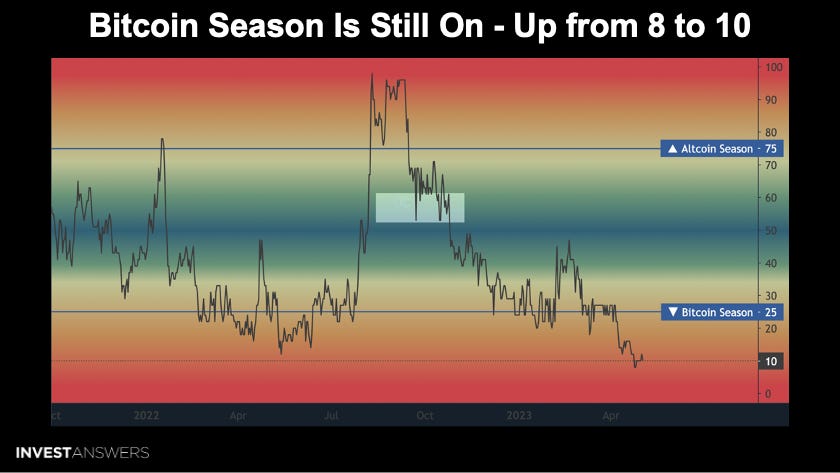
Bitcoin’s relative strength is reflected in this chart as we remain in the BTC season.

BTC is up 21%, and the QQQ is up 7.87% over the last 90 days.

The market remains greedy or bullish in crypto’s outlook.

Solana is number one this week with 325,757 daily active users
Polygon (MATIC) comes in just under 322,421
Ethereum is third at 290,728
Things can change in this space very quickly which we review this each week.

I argue that MicroStrategy is a better solution than a spot BTC ETF. MicroStrategy, a software company that has become a proxy for Bitcoin, reported Q1 earnings of $31.79 per share, beating expectations for a loss of $1.28 per share, thanks to its Bitcoin holdings. The company holds 140,000 Bitcoins for a total cost of $4.2 billion.
The leadership hinted that it may sell some of its holdings to pay off $2.208 billion in debt due by 2025. However, MicroStrategy remains bullish on Bitcoin, with its CEO stating that the conviction in its Bitcoin strategy remains strong. The company continues to increase its holdings, having purchased 7,500 Bitcoins in the last quarter for $179 million.
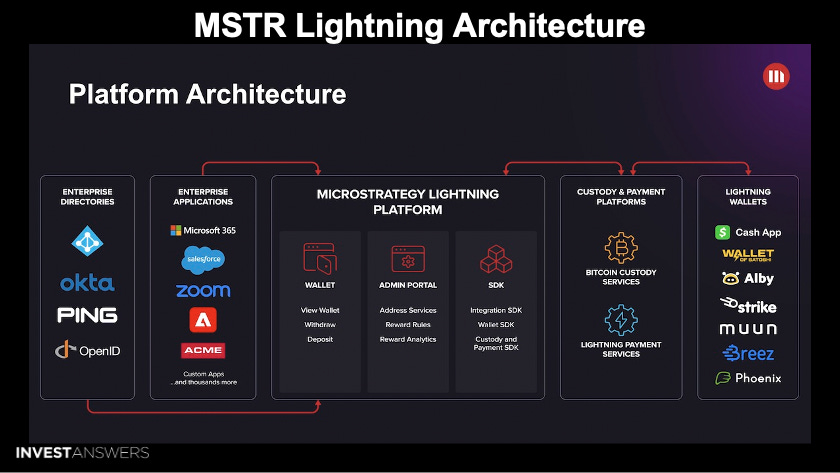
MicroStrategy Lighting Enterprise Platform Architecture:
Faster and cheaper payments
Increased scalability
Improved privacy
Reduced risk of fraud
Micropayments
Cross-border payments
Point-of-sale payments
Invoice payments
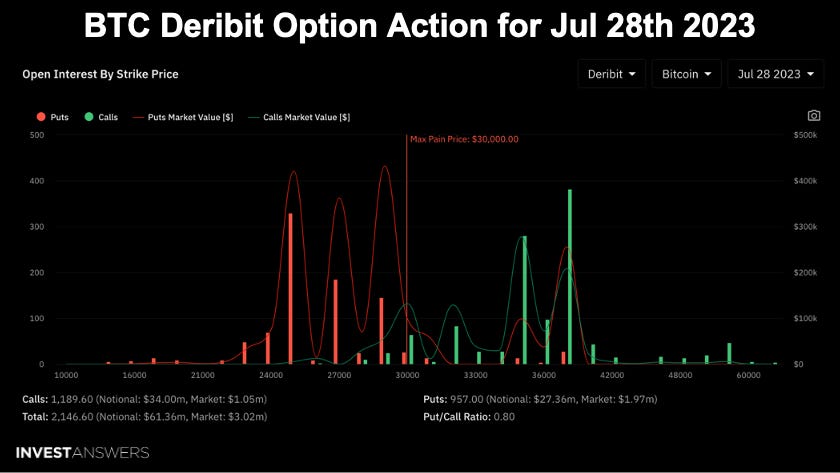
While summer could be a doldrum stage for price action, big money is placing bets on the continued rise in Bitcoin price.
The put/call ratio is 0.80, which is still bullish.
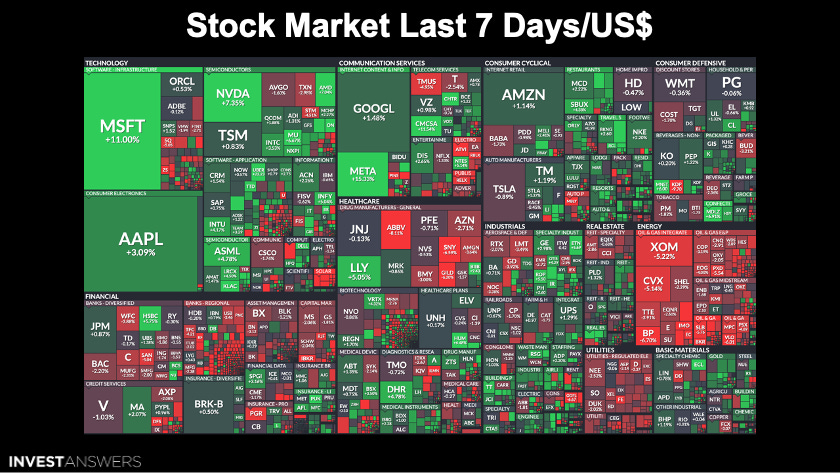
MSFT up ~11%
AAPL up ~3%
NVDA up ~7%
TSLA is down ~1%, as its price action continues to run contrary to the overall market’s performance
Keep reading with a 7-day free trial
Subscribe to InvestAnswers Newsletter to keep reading this post and get 7 days of free access to the full post archives.