
RECAP: 90.7% WIN RATE W/ MEAN REVERSION
TA Masterclass: Mean Reversion Trading Tool: 90.7% Win Rate!

Introducing the world's best tool for optimizing pair trading on a volatile day in the market where Tesla falls 9% and Solana goes up 8%: Mean Reversion (an indicator that is part of IADSS), which is available on our website.
The premise of this strategy is that assets will revert to their respective average price over time. And the best things in life are simple, like this strategy.
I am a value investor in disruptive assets and like to buy them cheaply. This is why I say, "Get in early, get in hard," when they are very oversold.
There are a lot of similarities to last week's lesson on PTOS:
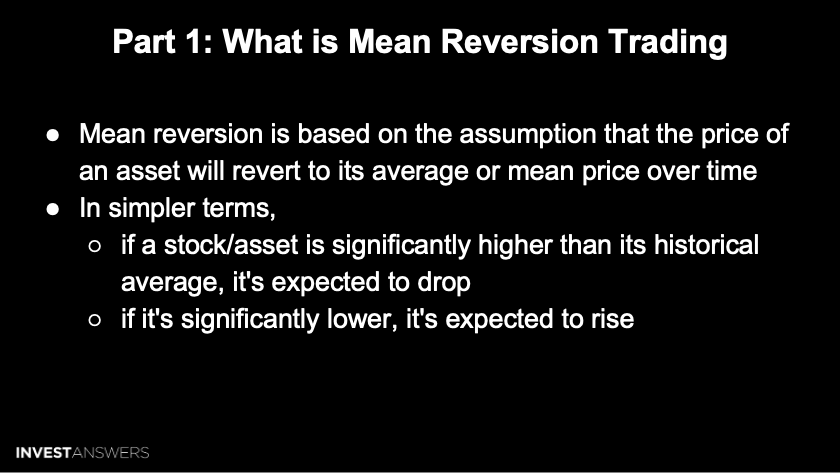
Stocks typically have an intrinsic or long-term average value. External events or market sentiment can cause significant price deviations from this value. Traders may overreact to news, causing abrupt price changes, but mean reversion theory posits that these prices will eventually revert to their intrinsic value as new information surfaces and initial reactions subside.
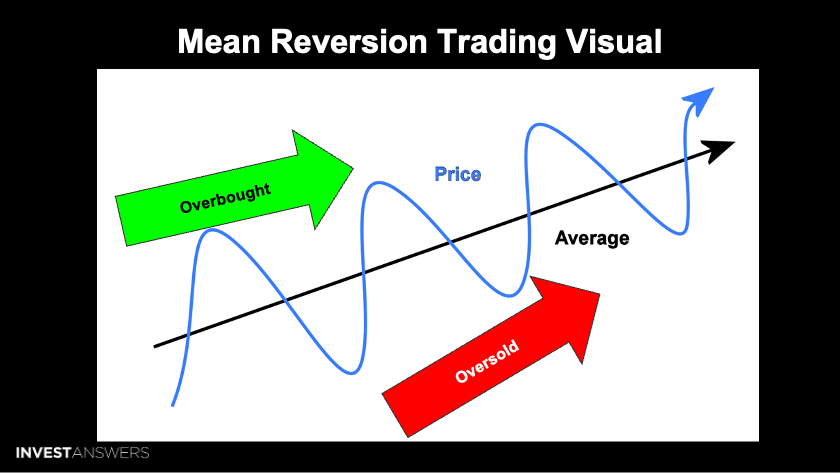
Here is a simple visual of what this strategy looks like. It is always good to be in assets that go up over time unless you are a "perma bear" on a particular asset or know the asset is going to zero. However, I like to trade things that are going up as I find it much easier to play.
Imagine that the black line is a daily moving average trend line, and you will notice that the price oscillates above and below the line while it travels along the upward channel. Generally, when it is below the line, this is the period to buy, and when it is above the line, it is the period to sell.
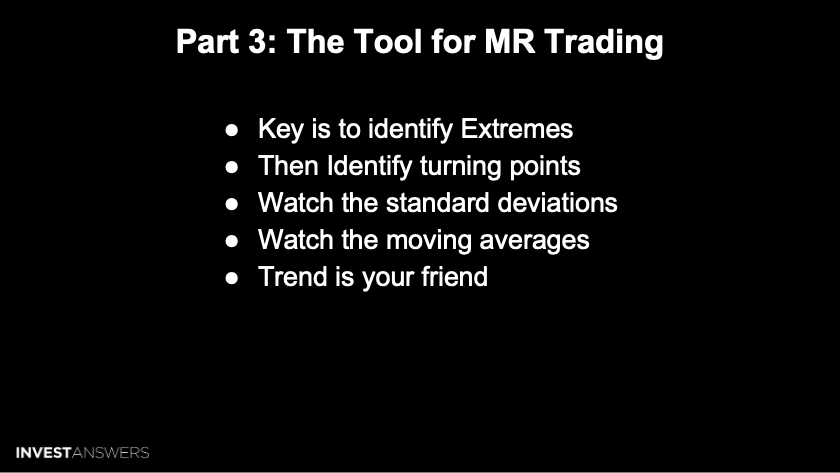
A lot of math goes into the models we build, and we use the TradingView interface to present the data in real-time to make it easy to understand. It is key to recognize price extremes and turning points indicating when the trend has flipped in the other direction. The standard deviations can be adjusted to suppress the noise if you only seek the peak buying or selling opportunities with the highest probability of success. And remember always that the trend is your friend.
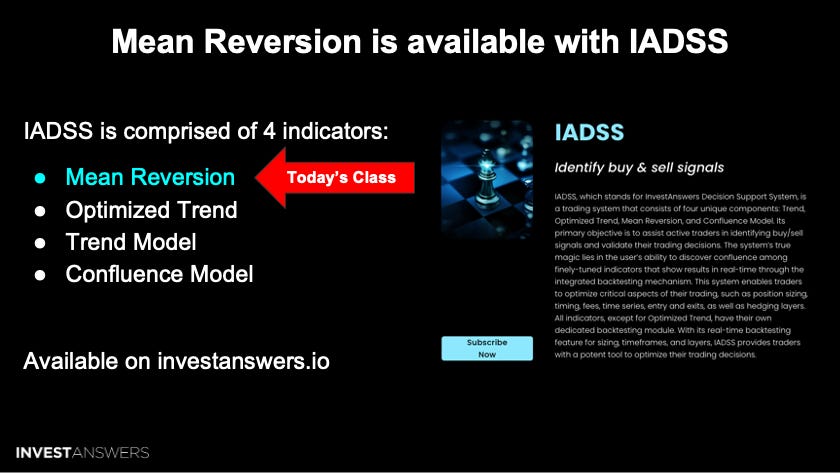
The Mean Reversion indicator is one of the critical tools in IADSS (aka InvestAnswers Decision Support System) which is a trading system that consists of four unique components: Trend, Optimized Trend, Mean Reversion, and Confluence Model.
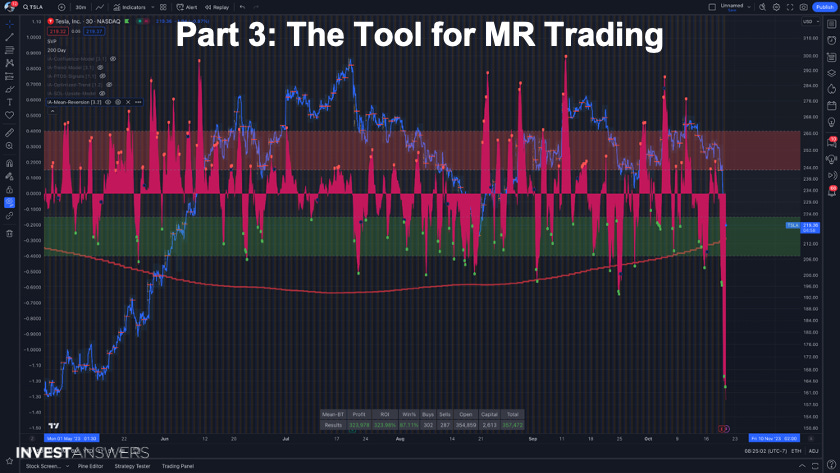
Here is a busy version of the Mean Reversion indicator on Tesla. Focus your eye on the link pink chart, which is the mean reversion. Recently, the price went multiple standard deviations away from the medium because of the quarterly earnings call, despite:
Did anything significantly change with the business? No.
Is Tesla the leading company in the world in AI? Yes.
Did Elon Musk state that Tesla will become the largest company in the world? Yes.
If you are playing the long game, Mean Reversion helps you identify the PICO moments like what we are currently in for Tesla.
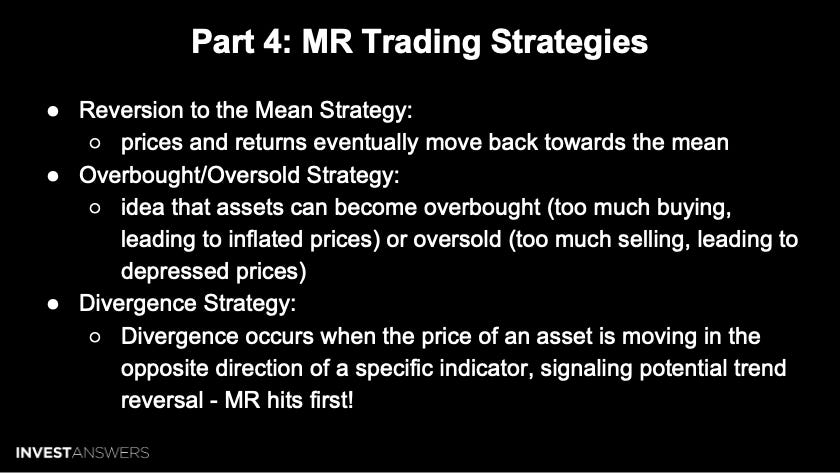
Reversion to the Mean Strategy:
Concept: This strategy is based on the principle that prices and returns eventually return to their historical average or mean over time.
Usage: Traders look for assets that have deviated significantly from their historical average, expecting them to revert back. For example, if a stock is trading above its historical average, a trader might expect its price to decrease.
Overbought/Oversold Strategy:
Concept: This strategy revolves around the idea that assets can become overbought (too much buying, leading to inflated prices) or oversold (too much selling, leading to depressed prices).
Usage: Traders utilize indicators like the Relative Strength Index (RSI) to gauge these conditions. An RSI reading above 70 might indicate an overbought condition, while a reading below 30 could indicate an oversold condition. Traders would then take positions expecting a reversal from these extreme conditions.
Crypto: This can be very helpful in assets like crypto, where the prices can be easily manipulated.
Divergence Strategy:
Concept: Divergence occurs when the price of an asset is moving in the opposite direction of a specific indicator, signaling potential trend reversals.
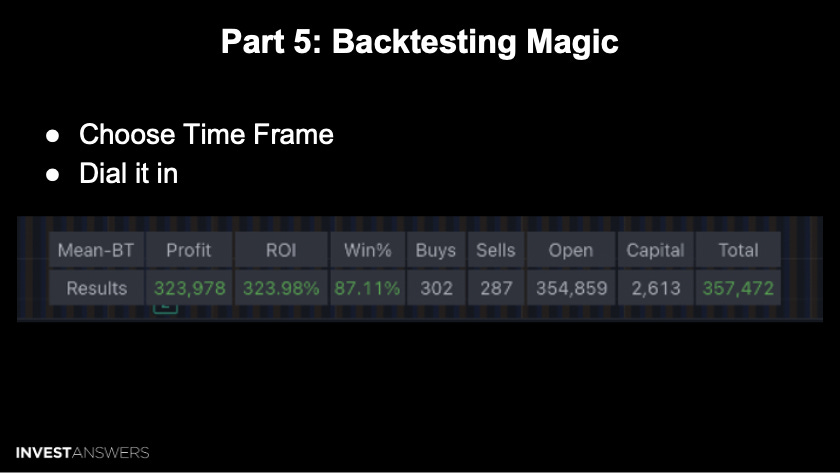
The Mean Reversion indicator comes with a backtesting feature. Depending on your trading style, you can dial in the model to fit you from a scalper (5-minute chart) to a swing trader (4-hour or daily chart).
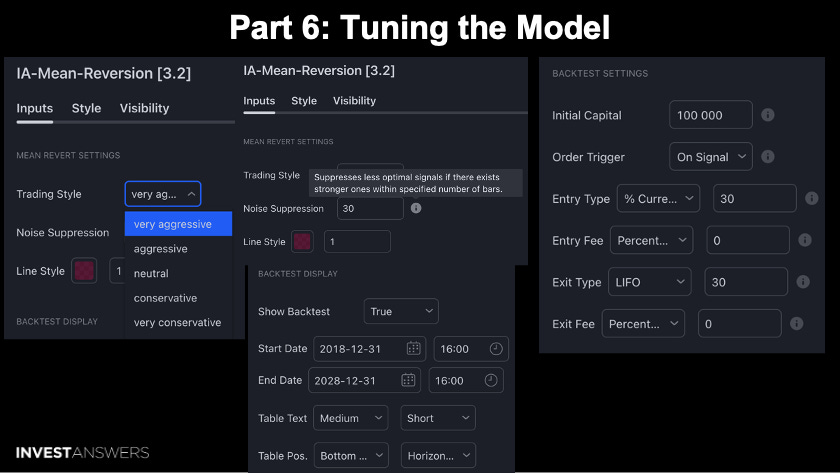
For this study, I am using the neutral settings (I call this RAW). Here are some of the additional means to tune in the model:
Trading Style: set this depending on the asset type
Very Conservative/Conservative = Walmart
Very Aggressive = Crypto or Tesla
Noise Suppression = @30 to reduce the number of dots on the screen
Show Backtest: True
Entry Type: 30
Exit Type: LIFO, 30
I like to double-tap into positions and double-tap out, so by default, I set the entry type to 30% and the exit type to LIFO 30%.
To put that in context, this strategy involves a methodical approach to entering and exiting stock positions:
I use a methodical approach when handling my stock positions:
When I buy, I like to double-tap into my positions. Instead of buying my entire desired amount all at once, I first buy 30% of what I intend to purchase. This means I'll buy in twice to total 60% of my intended position. This method helps me average my buying price in case the stock's value fluctuates between my two buying points.
When selling, I also double-tap out. I don't sell everything in one go; I sell in increments. Using the Last In, First Out (LIFO) approach, I sell the stocks I bought most recently first. Each time I decide to sell, I let go of 30% of my holdings. This strategy allows me to leverage varying selling prices, potentially maximizing my gains.
This strategy gives me more flexibility in managing my stocks, helps buffer against market volatility, and could optimize when I enter and exit my positions.
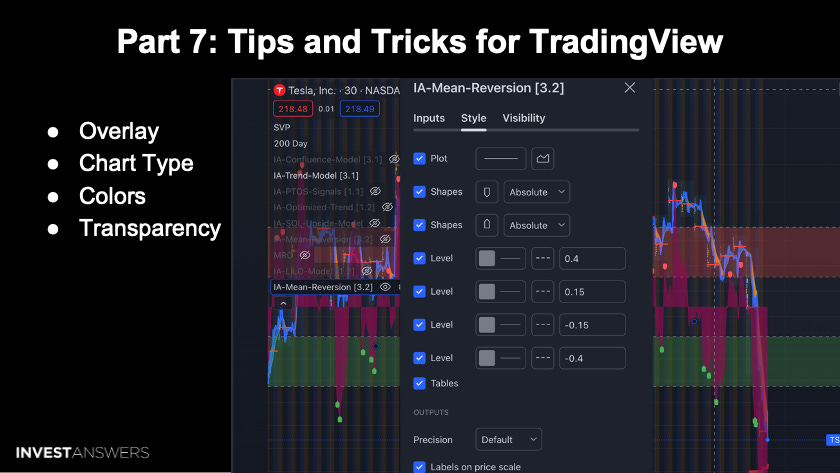
I am very visual, but sometimes, it can be too much for certain people. So, there are different ways to present the actionable model data to fit your preferences.
Bitcoin Chart Review Nuggets:
Noise Suppression: 0 supplies the most signal; my default is 30 for optimal PICO opportunities
WIN% - changes as the price of the BTC changes
A Green Dot below the mean reversion indicates that the price trend is in the process of turning up, which is a buy signal
A Red Dot above the mean reversion line indicates that the price trend is in the process of turning down, which is a sell signal
The Trend on the price chart will either keep you out of the trade or into the trend as a verifying point of confluence.
META Chart Review Nuggets:
When you can align high levels of WIN% probability in the Trend, Reversion, and Confluence indicators (part of IADSS), then you are going to win in that trade in almost every situation, which is the objective of IADSS
CLSK Chart Review Nuggets:
When CLSK's mean reversion hit over 2.0 standard deviations for the first time in years, it became a clear signal to short the stock at ~$7.50
Validated the technical indication with the business fundamentals
GOOG Chart Review Nuggets:
GOOG's recent chart allows for trading with great regularity about once per day
Stick with the 4-hour because when you are looking at a large number of assets, there will always be opportunities to do a trade somewhere daily
SOLUSD/ADAUSD Chart Review Nuggets:
This chart has been a rocky road with huge swings and deviations from the mean for the pair as they run at different times
Pair trading using Mean Reversion is not the same as Pair Trading on Steroids, which uses inversely correlated assets
The Optimized Trend (part of IADSS) gives me a macro view, which I use to identify when to stay in or stay out of the trade; it is built around the asset itself
The Trend (part of IADSS) is used for trading at a specific time when I want to find confluence between the three indicators to achieve a WIN% of 80+ between Confluence, Mean Reversion, and Trend Model (all part of IADSS)
There is a lot to digest here - don’t expect to absorb it all in one fell swoop! This is nearly 35 years of approach baked into one substack on just one of my models.
